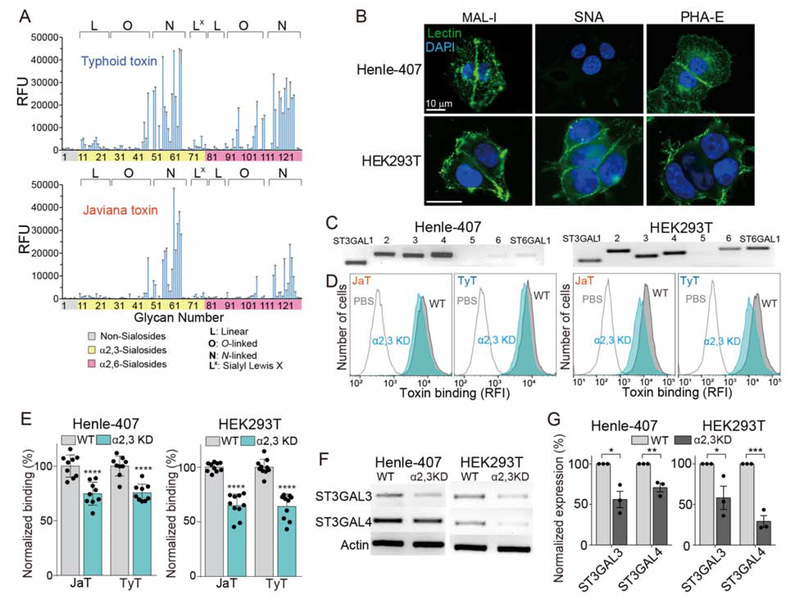
Figure 2. Glycan Binding Preferences of Typhoid and Javiana Toxins Are Similar in a Broader Context, yet Markedly Different in Specific Details.
A, Glycan array analyzing glycan-binding preferences of typhoid and Javiana toxins. RFU, relative fluorescent unit, represents toxin bindings to glycans in the array. B, Unpermeabilized Henle-407 and HEK293T cells stained with MAL-1-FITC, SNA-FITC, and DAPI. Scale bar, 10 μm. C, qRT-PCR analysis of enzymes involved in the biosynthesis of α2–3 and α2–6 sialosides. D-E, Toxin bindings to ST3GAL3- and ST3GAL4-depleted Henle-407 and HEK293T cells. KD, knockdown. Shown are representative histograms (D) and quantification results (E). F-G, qRT-PCR results of ST3GAL3- and ST3GAL4-depleted cells used in D and E. Shown are representative gel images (F) and quantification (G). At least three independent experiments were performed. Bars represent average ± standard deviation. *, p<0.05, **, p<0.01, ***, p<0.001, ****, p<0.0001. Two-tailed unpaired t-tests were used for E and G. See also Table S1.

