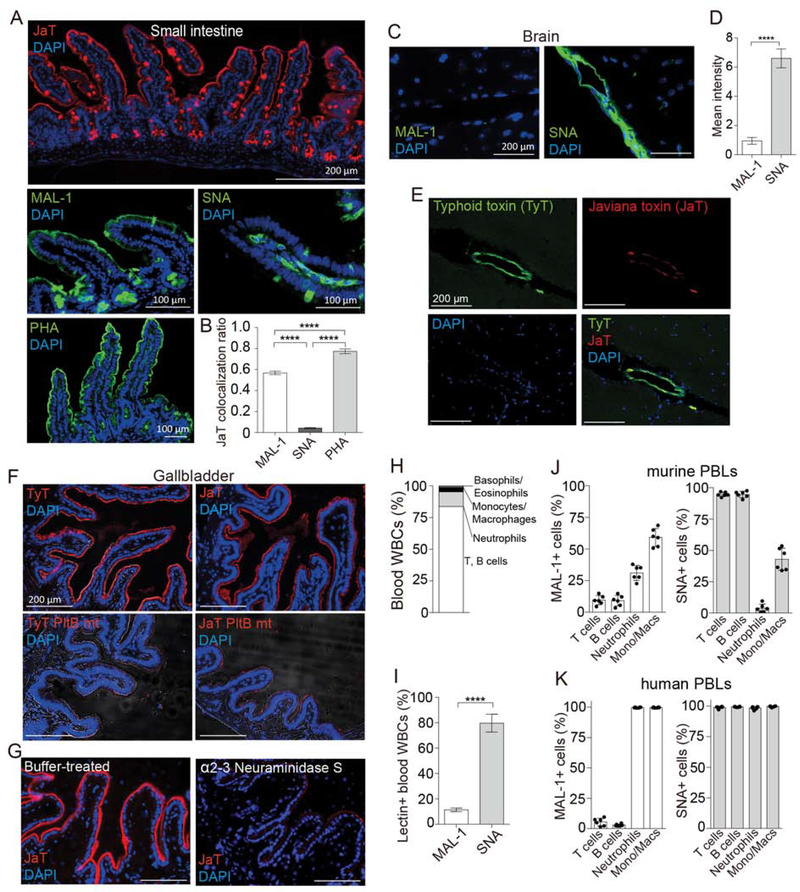
Figure 3. Glycan Binding Preferences of Typhoid and Javiana Toxins Are Correlated with Glycan Expression Profiles of Target Cells at the Primary Infection or Intoxication Sites of Two Salmonella that Produce the Toxins.
A, Shown are representative small intestine tissue sections of CMAH null mice stained with Javiana toxin-AF555, MAL-1-FITC, SNA-FITC, PHA-FITC, and DAPI. B, Colocalization of Javiana toxin with lectins indicated in A in intestinal epithelial cells. C, Glycan expression profiles of the endothelial cells of arterioles in the CMAH null mouse brain. Brain tissue sections of CMAH null mice were stained with MAL-1-FITC, SNA-FITC, and DAPI. D, Quantification results associated with C. E, Representative brain tissue sections of CMAH null mice that were intravenously administered a 1:1 mixture of typhoid toxin-AF488 and Javiana toxin-AF555. DAPI was used to counterstain the tissue sections. F, Shown are representative gallbladder tissue sections of CMAH null mice stained with typhoid toxin-AF555 (top left), Javiana toxin-AF555 (top right), typhoid toxin PltBS35A-AF555 (a glycan-binding defective mutant of typhoid toxin; bottom left), and Javiana toxin PltBS35A-AF555 (a glycan-binding defective mutant of Javiana toxin; bottom right). DAPI was used to counterstain the tissues. G, Gallbladder tissue sections of CMAH null mice treated for 1 hr with either buffer only (left) or α2–3 Neuraminidase S (right) followed by staining with Javiana toxin-AF555 and DAPI. H, Subtypes of circulating white blood cells (WBCs) of CMAH null mice were counted in a hematology analyzer. I, Murine PBLs predominantly express α2–6 form of sialylated multiantennary N-linked glycans. J, α2–3 and α2–6 sialosides on the cell surface of murine PBLs. K, α2–3 and α2–6 sialosides on the cell surface of human PBLs. At least three independent experiments were performed. Bars represent average ± standard deviation. ** p<0.01. **** p<0.0001. n=6–9 per group. Two-tailed unpaired t-tests. Scale bar in A (top panel), C, E, F and G, 200 μm; scale bar in the middle and bottom panels, 100 μm. See also Figure S1.

