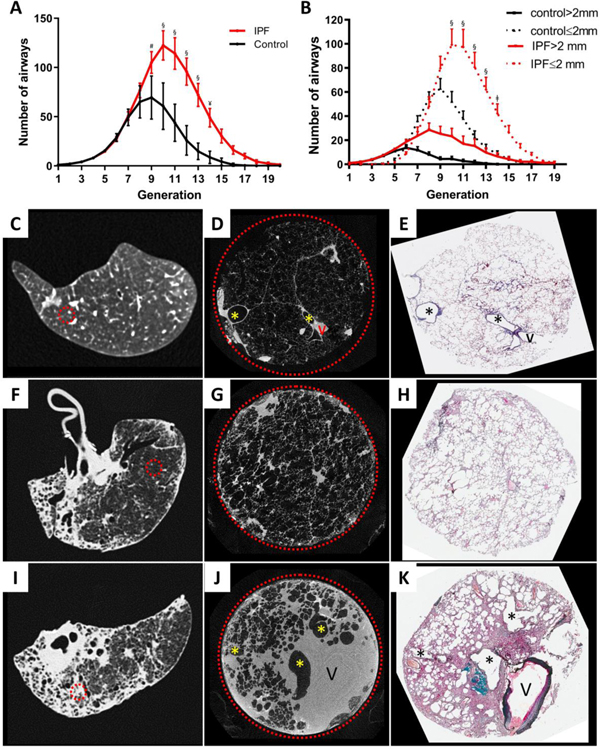
Figure 1:
(A) Comparison of the distribution of mean ± SEM number of airways visible on the airway tree, reconstructed at the 800μM spatial resolution of the MDCT specimen scans at each branching generation shows an increase in the number of visible airway in IPF compared to the control lungs beyond generation 8 in experiment 1. (B). Shows this increase in number occurs primarily in airways ≤2 mm per generation show the greatest increase in visible airways occurs in the airways ≤2 mm in diameter. (C) MDCT specimen scan images of control lung (D and E) lungs affected by IPF where the circled areas represent regions of minimal (D) and established (E) fibrosis, selected by the radiologists who examined the preoperative MDCT scans. MicroCT scans of tissues taken from the circled areas were used for comparisons among control, minimal and established fibrotic regions (F, G, and H, respectively). § = <0∙0001, ¥ = 0∙0001, # = 0∙0023, ǂ = 0∙0027, V indicates vessels and * indicates airways.

