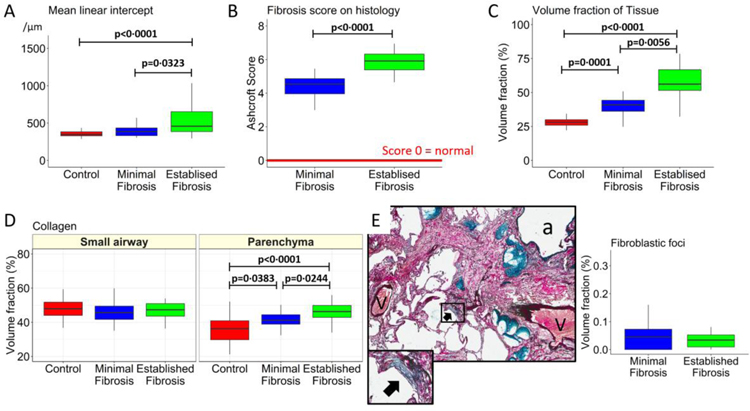
Figure 4:
The progression from control lung anatomy to minimal and established fibrosis is associated with an increase in Lm in experiment 2 (A). (B) The histology-based Ashcroft fibrosis score that ranges between 0 (normal) and 8 (dense fibrosis) was greater in established fibrosis than minimal fibrosis. (C) The volume fraction of the lung samples taken up by tissue. (D) The volume fraction of lung tissue taken up by collagen identified by picro sirius red staining used to identify collagen, in the parenchyma but not the airways. (E) Example of a fibroblastic focus, showing that the volume fraction was similarly increased in both minimal and established fibrosis. Values are expressed as per sample.

