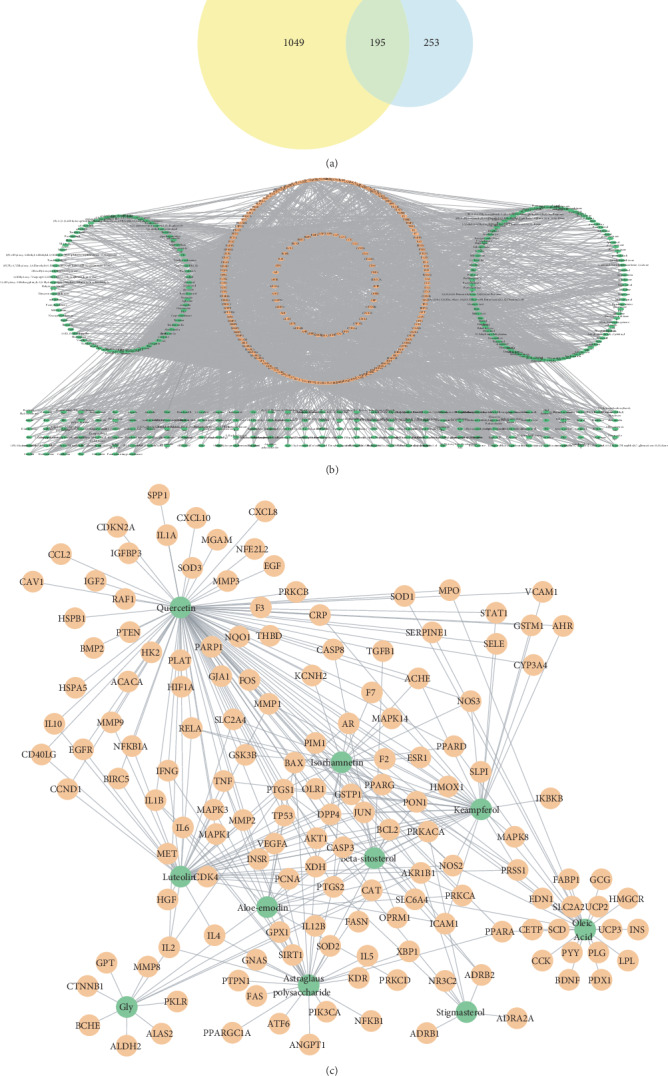
Figure 2.

Network construction. (a) Venn diagram of diabetes-related targets and SQC-related targets. The yellow circle represents diabetes-related targets, and the blue circle represents SQC-related targets. (b) The network of compound-target in SQC. The green nodes represent the active compound in SQC. The blue nodes represent the potential targets. The edges represent the interaction between the blue and green nodes. (c) Top 10 ingredients and their targets. The green nodes represent the ingredients, the orange nodes represent the targets, and the edges represent the interaction between them.
