Figure 5.

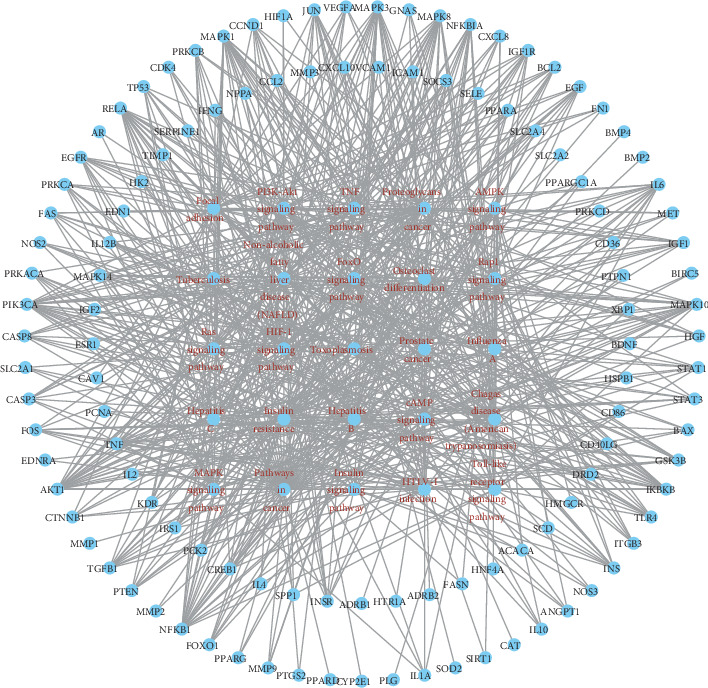
The network of the target-pathway in SQC. The red nodes represent the pathway of SQC in the treatment of DM. The blue nodes represent the target genes. The edges represent the interaction between the red and blue nodes.

The network of the target-pathway in SQC. The red nodes represent the pathway of SQC in the treatment of DM. The blue nodes represent the target genes. The edges represent the interaction between the red and blue nodes.