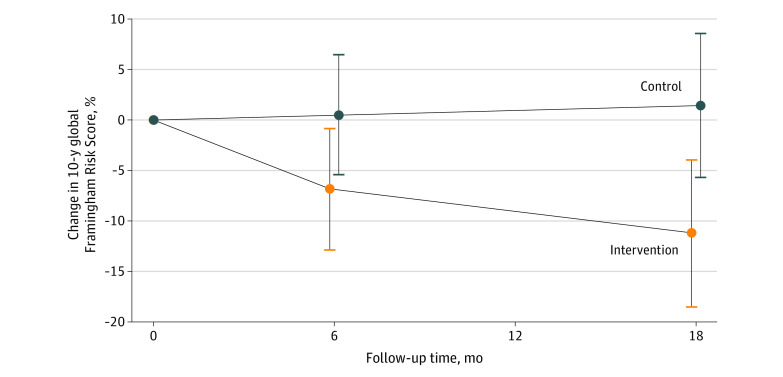
Figure 2. Percentage Change in 10-Year Global Framingham Risk Score Over Time According to Study Group.
The Global Framingham Risk Score reflects the 10-year probability of a cardiovascular event. The numbers of participants in the intervention group were 132 at baseline, 123 at 6 months, and 124 at 18 months. The numbers of participants in the control group were 137 at baseline, 126 at 6 months, and 132 at 18 months. Percentage change estimates (circles) and 95% CIs (error bars) are derived from mixed-effects repeated measures analysis using all available data from all randomized participants. Compared with the control group, the intervention group experienced a mean relative reduction in Framingham Risk Score of 12.7% (95% CI, 2.5%-22.9%; P = .02).

