Figure 2.
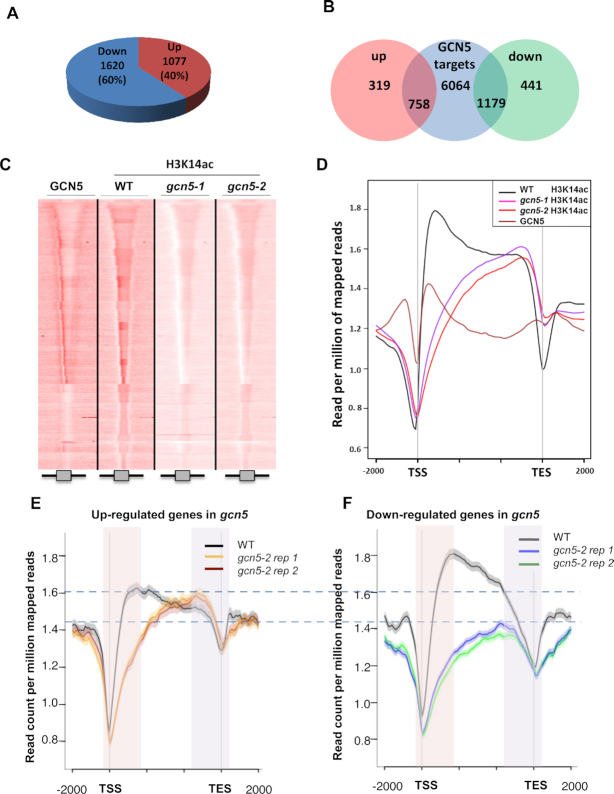
GCN5 can either activate or repress gene expression by controlling H3K14ac distribution on its target genes (A) Summary of changes in gene expression observed in gcn5 mutant. 60% of gcn5 deregulated genes are down-regulated (1620 genes) whereas 40% are up-regulated (1077 genes). (B) Venn diagram representing the overlap between GCN5 targets, identified by ChIP-seq, and the misregulated genes in gcn5 mutant. (C) H3K14ac chromatin profiles in WT, gcn5-1 and gcn5-2 mutants compared to GCN5. Comparison of tag density in the region of ±2 kb around ORFs. ChIP-seq were performed on 14-day-old seedlings grown under long day condition conditions. (D) Merged profiles of GCN5 and H3K14ac in WT, gcn5-1 and gcn5-2 mutants. Mean-normalized ChIP-Seq densities of equal bins along the gene and 2kb region flanking the TSS and the TES were plotted. (E) Merged H3K14ac profiles in WT and gcn5-2 mutant (two biological replicates), restricted to genes that are both GNC5 targets and up-regulated in gcn5-2 mutant. Mean-normalized ChIP-Seq densities of equal bins along the gene and 2kb region flanking the TSS or the TES were plotted. Shadings highlight 5′ (red) and 3′ (purple) gene end regions. (F) Merged H3K14ac profiles in WT and gcn5-2 mutant (two biological replicates), restricted to genes that are both GNC5 targets and down-regulated in gcn5-2 mutant. Mean-normalized ChIP-Seq densities of equal bins along the gene and 2kb region flanking the TSS or the TES were plotted. Shadings highlight 5′ (red) and 3′ (purple) gene end regions.

