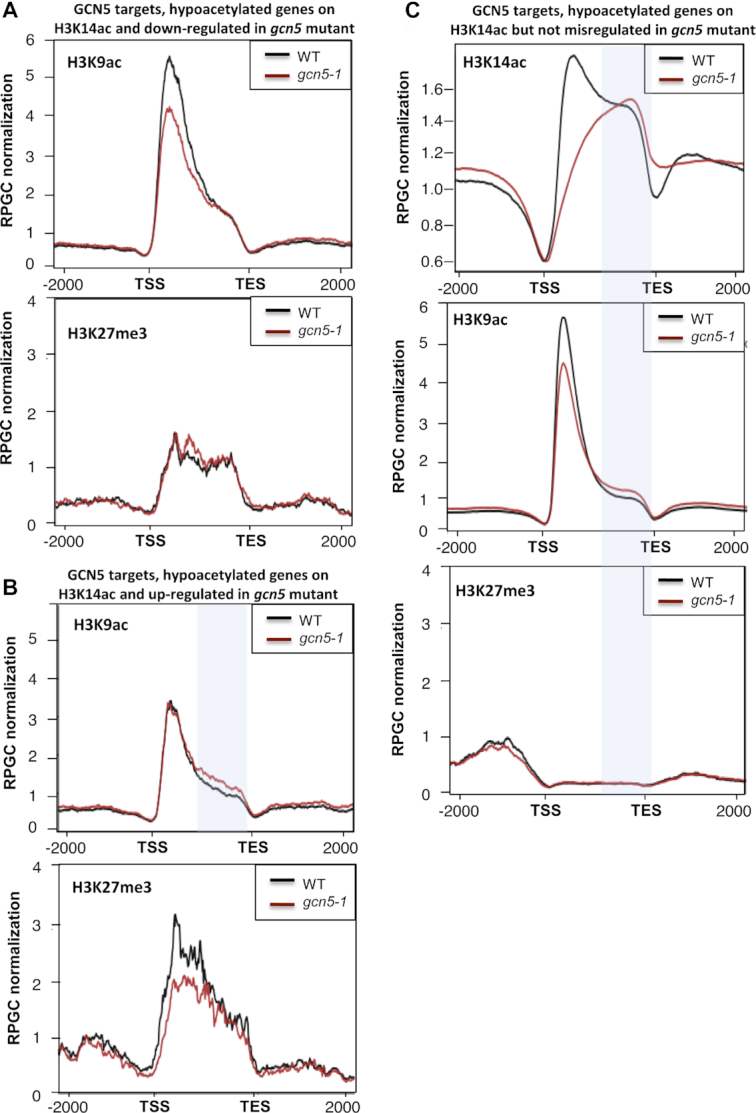
Figure 3.

GCN5 influences the deposition of H3K9ac through its action on H3K14ac. (A) (top) H3K9ac merged profiles of WT and gcn5-1 mutant, restricted to genes that are both GNC5 targets and down-regulated in the mutant. (bottom) H3K27me3 merged profiles of WT and gcn5-1 mutant, restricted to genes that are both GNC5 targets and down-regulated in the mutant. Mean-normalized ChIP-Seq densities of equal bins along the gene and 2kb region flanking the TSS and the TES were plotted. (B) (top) H3K9ac merged profiles of WT and gcn5-1 mutant, restricted to genes that are both GNC5 targets and up-regulated in the mutant. (bottom) H3K27me3 merged profiles of WT and gcn5-1 mutant, restricted to genes that are both GNC5 targets and up-regulated in the mutant. The blue shading highlights the 3′ end part where H3K14ac hyperacetylation is observed on the same set of genes. Mean-normalized ChIP-Seq densities of equal bins along the gene and 2 kb region flanking the TSS and the TES were plotted. (C) (top) H3K14ac merged profiles of WT and gcn5-1 mutant, restricted to genes that are both GNC5 targets and not differentially expressed in the mutant. (middle) H3K9ac merged profiles of WT and gcn5-1 mutant, restricted to genes that are both GNC5 targets and not differentially expressed in the mutant. (bottom) H3K27me3 merged profiles of WT and gcn5-1 mutant, restricted to genes that are both GNC5 targets and not differentially expressed in the mutant. The blue shading highlights the 3′ end part where H3K14ac hyperacetylation is observed. Mean-normalized ChIP-Seq densities of equal bins along the gene and 2kb region flanking the TSS and the TES were plotted.
