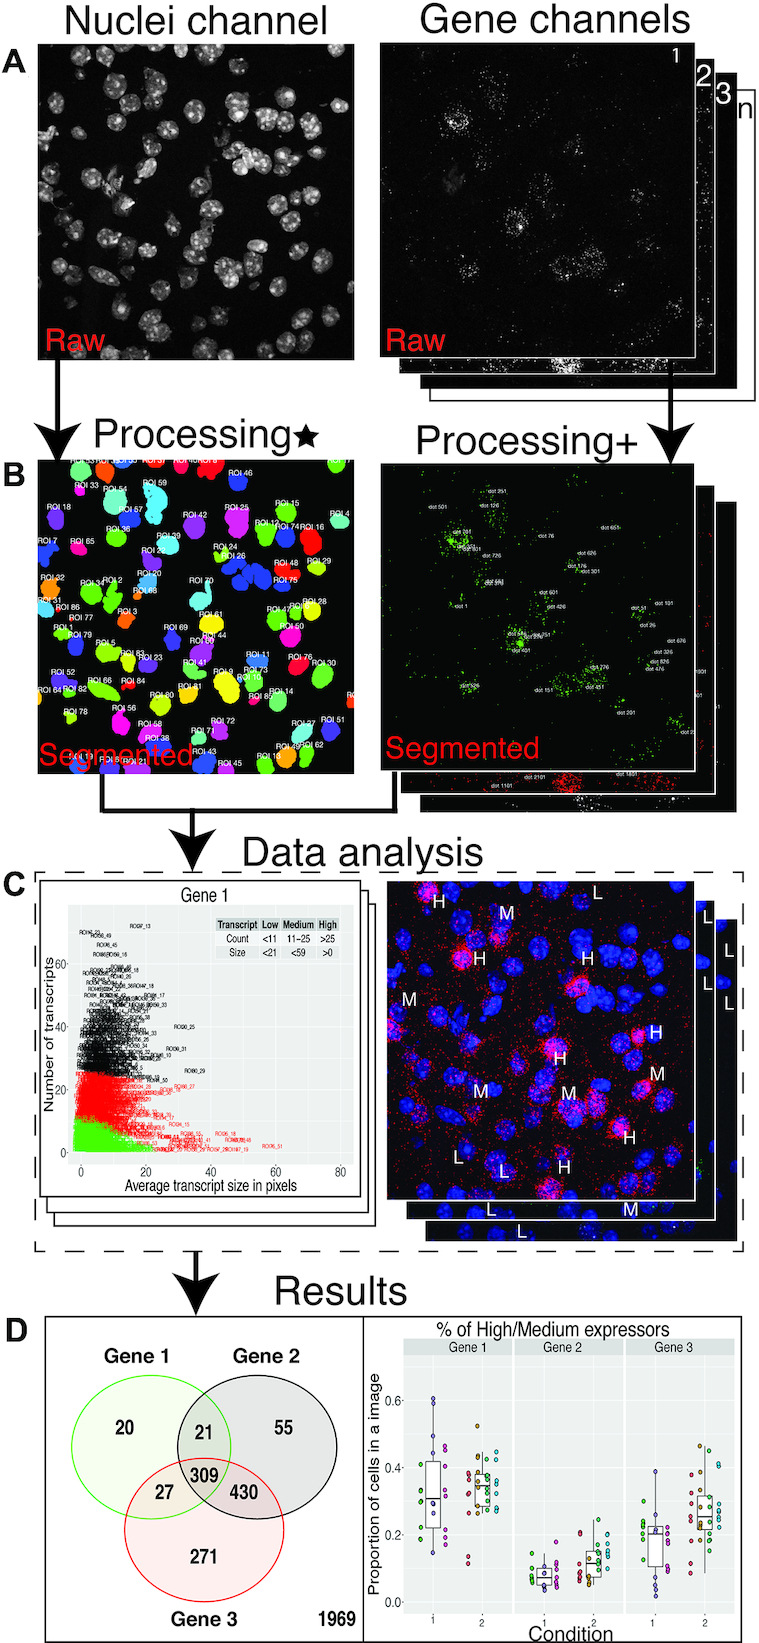
Figure 2.

Dotdotdot image processing and data analysis workflow: (A) Raw ‘.czi’ images of nuclei and gene channels. (B) Final segmented images of nuclei and gene channels (Processing* involves gaussian smoothening, adaptive thresholding and watershed segmentation of nuclei channel, Processing+ involves background filtering, histogram-based thresholding and watershed segmentation of transcript channel). (C) Data analysis steps (for example, K-means) that are executed based on metrics from segmented images. (D) Predictions from data analysis steps are used to produce final results.
