Figure 5.
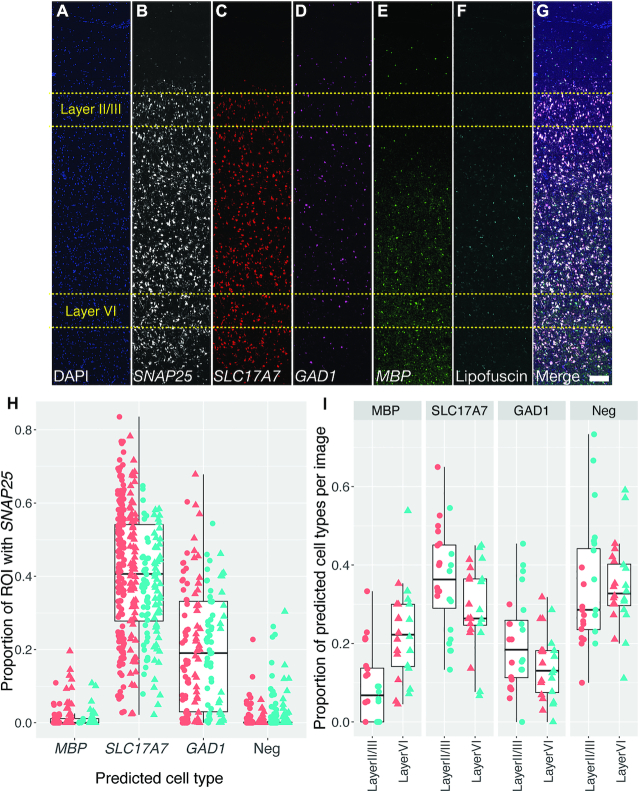
Layer-specific cell type analysis in post-mortem human DLPFC demonstrates sensitivity and specificity of dotdotdot for transcript quantification. (A–G) Maximum z-projection of unmixed and stitched lambda stacks acquired across a single cortical strip (layer I to VI) of post-mortem human DLPFC depicting expression of DAPI (A), SNAP25 (B), SLC17A7 (C), GAD1 (D), MBP (E), lipofuscin (F) and merged (G). High magnification (63×) images used for analysis were randomly acquired within a strip in layer II/III (80–90% of strip thickness; n = 24 images total) or layer VI (20–30% of strip thickness; n = 24 images total) from 2 individuals from 2 different strips (see Figure 3 for representative 63x image). (H) Validation of cell type calling using CART analysis demonstrating an enrichment of SNAP25 transcripts in predicted excitatory (SLC17A7) and inhibitory (GAD1) neurons compared to oligodendrocytes (MBP) and SLC17A7-/GAD1-/MBP- cells (likely astrocytes and microglia). Color represents different subjects and shape represents different layers (circle = layer II/III and triangle = layer VI). (I) Proportion of cortical cells expressing markers for neurons, excitatory neurons, inhibitory neurons, and oligodendrocytes in layer II/III versus layer VI of DLPFC (n = 519 ROIs layer II/III and n = 442 ROIs layer VI). Scale bar is 200 um.

