Figure 1.
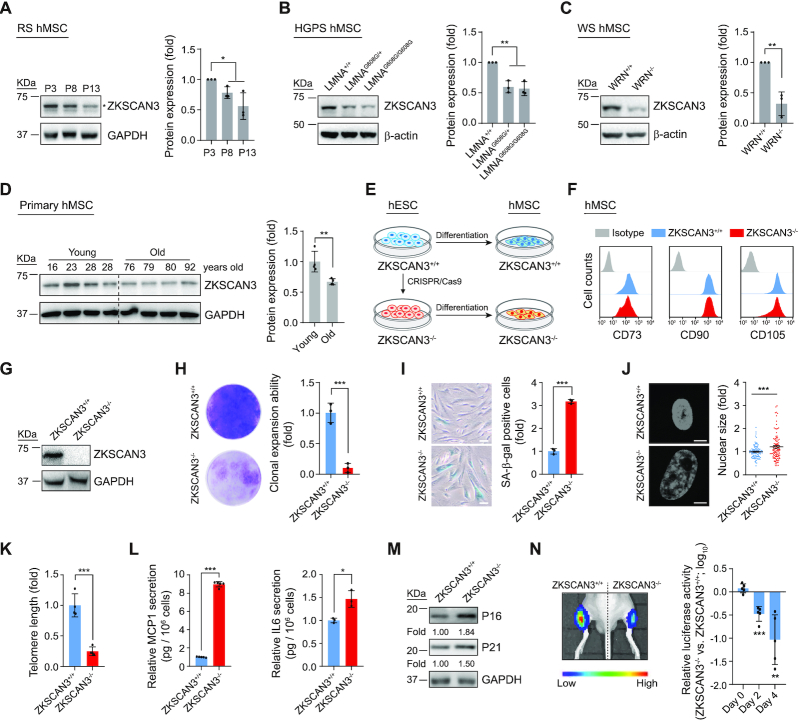
Absence of ZKSCAN3 results in premature cellular senescence in hMSCs. (A) Western blot analysis of ZKSCAN3 protein in early-, middle- and late-passage (P3, P8, P13) hMSCs. Representative western blot images are shown on the left, and the statistical analysis of relative protein expression levels of ZKSCAN3 is on the right. GAPDH was used as the loading control. Data are presented as the mean ± SEMs, n = 3. *P < 0.05 (two tailed t-test). The asterisk indicates the band of ZKSCAN3 and P indicates passage. (B) Western blot analysis of ZKSCAN3 protein in LMNA+/+, LMNAG608G/+ and LMNAG608G/G608G hMSCs (P7). Representative western blot images are shown on the left, and the statistical analysis of the relative protein expression levels of ZKSCAN3 is on the right. β-actin was used as the loading control. Data are presented as the mean ± SEMs, n = 3. *P < 0.05, **P < 0.01 (two tailed t-test). (C) Western blot analysis of ZKSCAN3 protein in WRN+/+ and WRN-/- hMSCs (P7). Representative western blot images are shown to the left, and the statistical analysis of the relative protein expression levels of ZKSCAN3 is on the right. β-actin was used as the loading control. Data are presented as the mean ± SEMs, n = 3. **P < 0.01 (two tailed t-test). (D) Western blot analysis of ZKSCAN3 protein in young and physiologically aged hMSCs (P7). Representative western blot images are shown on the left, and the statistical analysis of the relative protein expression levels of ZKSCAN3 is on the right. GAPDH was used as the loading control. Data are presented as the mean ± SEMs, n = 4. **P < 0.01 (two tailed t-test). (E) Schematic of hMSC differentiation. (F) FACS analysis of hMSC surface markers CD73, CD90 and CD105 in ZKSCAN3+/+ and ZKSCAN3-/- hMSCs. (G) Western blot analysis of ZKSCAN3 protein in ZKSCAN3+/+ and ZKSCAN3-/- hMSCs (P4). GAPDH was used as the loading control. (H) Clonal expansion ability analysis of ZKSCAN3+/+ and ZKSCAN3-/- hMSCs (P10). Data are presented as the mean ± SEMs, n = 3. ***P < 0.001 (two tailed t-test). (I) SA-β-gal staining of ZKSCAN3+/+ and ZKSCAN3-/-hMSCs (P10). Scale bar, 100 μm. Data are presented as the mean ± SEMs, n = 3. ***P < 0.001 (two tailed t-test). (J) Staining of cell nuclei by Hoechst 33342 in ZKSCAN3+/+ and ZKSCAN3-/- hMSCs (P10). The relative nuclear size is shown on the right. Scale bar, 10 μm. Data are presented as the mean ± SEMs, n = 300. ***P < 0.001 (two tailed t-test). (K) Telomere length analysis of ZKSCAN3+/+ and ZKSCAN3-/- hMSCs (P10) by qPCR. Data are presented as the mean ± SEMs, n = 4. ***P < 0.001 (two tailed t-test). (L) ELISA analysis of the secretion of MCP1 and IL6 in ZKSCAN3+/+ and ZKSCAN3-/- hMSCs (P10). Data are presented as the mean ± SEMs, n = 5 for MCP1 detection, n = 3 for IL6 detection. *P < 0.05, ***P < 0.001 (two tailed t-test). (M) Western blot analysis of P16, P21 in ZKSCAN3+/+ and ZKSCAN3-/- hMSCs (P10). GAPDH was used as the loading control. (N) ZKSCAN3+/+ and ZKSCAN3-/- hMSCs infected with a lentivirus expressing luciferase were implanted into the tibialis anterior (TA) muscle of nude mice. Luciferase activities were detected at day D0, D2 and D4 after injection by an in vivo imaging system (IVIS). Data are presented as the mean ± SEMs, n = 5. **P < 0.01, ***P < 0.001 (two tailed t-test).

