Figure 2.
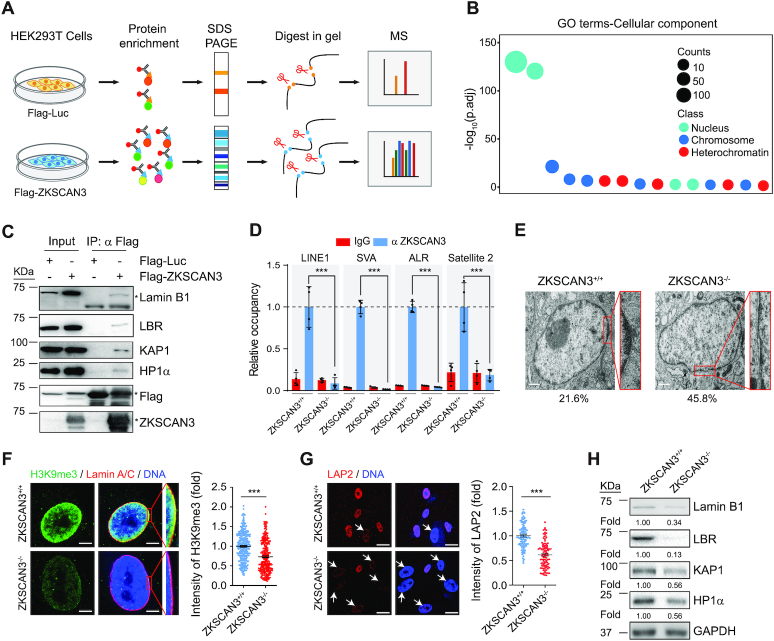
ZKSCAN3 forms a complex with heterochromatin proteins and nuclear envelope proteins in hMSCs. (A) Schematic representation of Co-IP followed by LC-MS/MS. (B) Gene Ontology Cellular Component (GO-CC) enrichment analysis of ZKSCAN3 interaction proteins identified by Co-IP/MS. (C) Co-IP analysis showing that exogenous ZKSCAN3 interacts with Lamin B1, LBR, KAP1 and HP1α proteins in HEK293T cells. The asterisks represent the bands of indicated proteins. (D) Enrichment of ZKSCAN3 within the regions of repetitive sequences (LINE1, SVA, ALR, Satellite 2) in ZKSCAN3+/+ and ZKSCAN3-/- hMSCs (P4) as measured by ChIP-qPCR. Data are presented as the mean ± SEMs, n = 4. ***P < 0.001 (two tailed t-test). (E) Representative TEM images for ZKSCAN3+/+ and ZKSCAN3-/- hMSCs (P10) showing reduced heterochromatin at the nuclear periphery in ZKSCAN3-/- hMSCs. The percentages of cells with heterochromatin loss at the nuclear periphery are shown on the bottom. Scale bar, 1 μm. (F) Immunostaining of H3K9me3 and Lamin A/C in ZKSCAN3+/+ and ZKSCAN3-/- hMSCs (P10). Scale bar, 5 μm. The mean intensity of H3K9me3 was measured with ImageJ and the calculated data are shown as the mean ± SEMs, n = 300. ***P < 0.001 (two tailed t-test). (G) Immunostaining of LAP2 in ZKSCAN3+/+ and ZKSCAN3-/-hMSCs (P10). White arrows represent the cells with decreased LAP2 expression. Scale bar, 25 μm. The mean intensity of LAP2 was measured with ImageJ and the calculated data are shown as the mean ± SEMs, n = 150. ***P < 0.001 (two tailed t-test). (H) Western blot analysis of the expression levels of Lamin B1, LBR, KAP1 and HP1α proteins in ZKSCAN3+/+ and ZKSCAN3-/- hMSCs (P10). GAPDH was used as the loading control.

