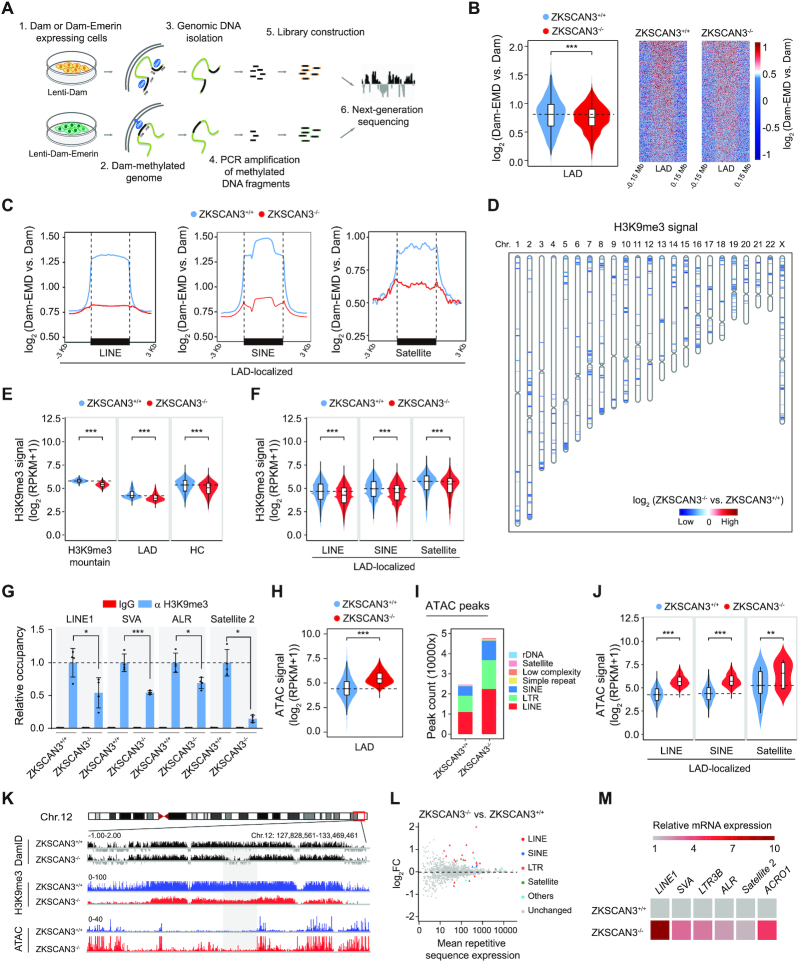
Figure 3.
ZKSCAN3 regulates heterochromatin architecture and represses repetitive sequence expression in hMSCs. (A) Schematic representation of DamID-seq strategy. (B) Reduced DamID signals [log2 (Dam-EMD vs. Dam)] at LAD regions in ZKSCAN3-/- hMSCs (P10) compared to ZKSCAN3+/+ hMSCs (P10), shown by both violin plot (left) and heatmaps (right). (C) Line plots showing DamID signals [log2 (Dam-EMD vs. Dam)] at LAD-localized repetitive sequence loci in ZKSCAN3+/+ and ZKSCAN3-/- hMSCs (P10). (D) Sketch map showing the loss of ‘H3K9me3 mountain’ distribution over 23 chromosomes in ZKSCAN3-/- hMSCs (P10) compared to ZKSCAN3+/+ hMSCs (P10). (E) Violin plots showing the loss of H3K9me3 signals in H3K9me3 mountains, LAD and heterochromatin (HC) regions in ZKSCAN3-/- hMSCs (P10) compared to ZKSCAN3+/+ hMSCs (P10). (F) Violin plots showing the loss of H3K9me3 signals at LAD-localized repetitive sequence regions (LINE, SINE, Satellite family) in ZKSCAN3-/- hMSCs (P10) compared to ZKSCAN3+/+ hMSCs (P10). (G) Enrichment of H3K9me3 within the regions of repetitive sequences in ZKSCAN3+/+ and ZKSCAN3-/- hMSCs (P10) as measured by ChIP-qPCR. Data are presented as the mean ± SEMs, n = 4. *P < 0.05, ***P < 0.001 (two tailed t-test). (H) Violin plot showing the increase of ATAC signals at ATAC-seq peaks within LADs in ZKSCAN3-/- hMSCs (P10) compared to ZKSCAN3+/+ hMSCs (P10). (I) The distribution feature of ATAC-seq peaks annotated to different repetitive sequence regions in ZKSCAN3+/+ and ZKSCAN3-/- hMSCs (P10). (J) Violin plots showing ATAC signals of LAD-localized repetitive sequence regions in ZKSCAN3+/+ and ZKSCAN3-/- hMSCs (P10). (K) Representative tracks of DamID-seq, H3K9me3 ChIP-seq and ATAC-seq analyses showing decreased DamID signal, reduced H3K9me3 signal coupled with increased ATAC signal in ZKSCAN3-/- hMSCs (P10) compared to ZKSCAN3+/+ hMSCs (P10). (L) RNA-seq analysis showing the increased mRNA expression levels of repetitive sequences in ZKSCAN3-/- hMSCs (P10) compared to ZKSCAN3+/+ hMSCs (P10). (M) Heatmap showing the mRNA expression levels of repetitive sequences in the ZKSCAN3+/+ and ZKSCAN3-/- hMSCs (P10) by RT-qPCR.

