Figure 5.

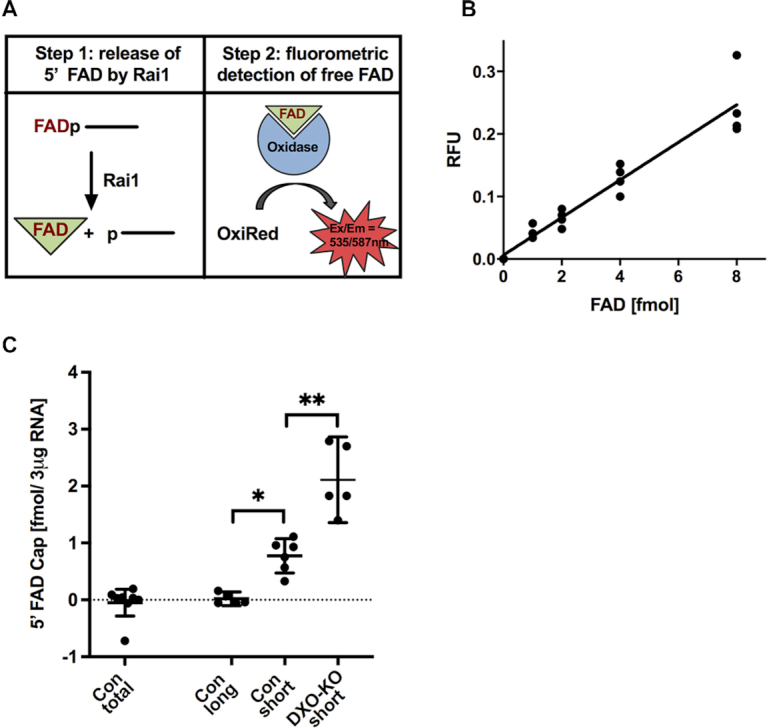
FAD-cap detection and quantitation assay. (A) Steps in FAD-capQ (see text). (B) FAD-capQ analysis of RNA generated in vitro. Increasing amounts of synthetic FAD-capped RNA were treated with SpRai1 and subject to FAD-capQ assay in the presence of 3 μg total RNA. Background signal detected without synthetic FAD-capped RNA was normalized to 1.0 and subtracted from each time point. (C) Total (50 μg), long (3 μg) and short (3 μg) RNAs from the indicated mammalian cells were subjected to FAD-capQ to detect levels of FAD caps. ‘Con’ indicates control knockout cells, ‘DXO-KO’ represents DXO knockout cells. Error bars represent ± SEM. Levels of statistical significance for at least five independent biological experiments were calculated using one-way Anova; *P = 0.018; **P = 0.0011.
