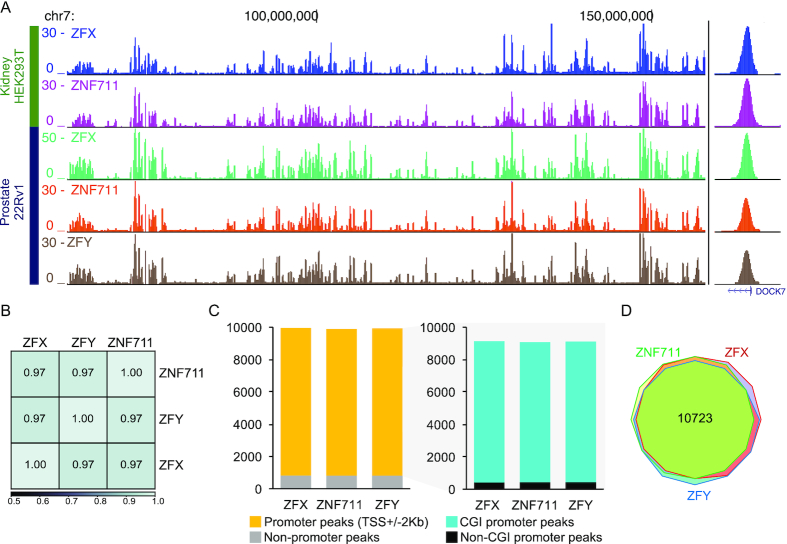
Figure 4.
ZFX family members have essentially identical binding patterns at CpG island promoters. (A) Browser tracks showing ZFX family member binding profiles in female HEK293T kidney cells and male 22Rv1 prostate cells. Also shown is a zoom in on a single peak located in the DOCK7 promoter region. (B) Shown is a heatmap illustrating the genome-wide correlation of ZFX family member binding patterns in 22Rv1 cells. (C) Bar graph of genomic distributions of ZFX family member binding sites in 22Rv1 cells in promoter and non-promoter regions (left) and bar graph showing the relative distribution of binding sites in CpG island (CGI) promoters and non-CpG island promoters (right). (D) Venn diagram comparing the sets of CpG island promoters bound by ZFX, ZFY and ZNF711 in 22Rv1 cells.

