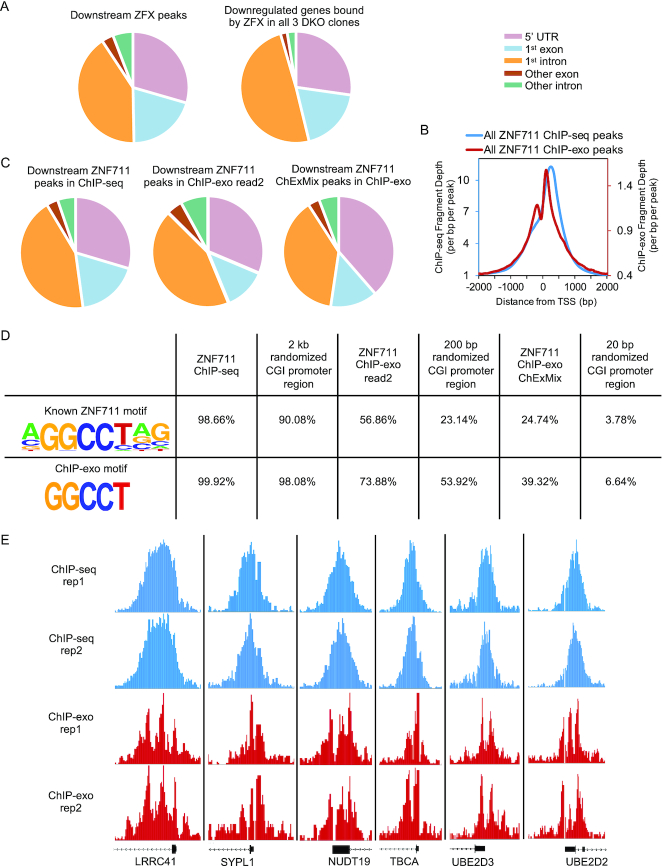
Figure 6.
Characterization of ZFX and ZNF711 binding sites. (A) Classification of binding sites based on genomic locations of all ZFX peaks located downstream of the TSS and ZFX downstream peaks at promoters of genes down-regulated in all 3 DKO clones. (B) Classification of ZNF711 downstream ChIP-seq peaks, downstream peaks identified using read2 of the ChIP-exo dataset, and downstream peaks identified by the ChexMix program (+/-10 nt from the nt identified as the binding site by the program). (C) Tag density plots of all ZNF711 peaks from standard ChIP-seq and from ChIP-exo. (D) Motif analysis using the top 5000 peaks identified from standard ZNF711 ChIP-seq (average width 1800 nt), ChIP-exo read2 (average width 300 nt), ChIP-exo by the ChexMix program (20 nt), and randomized CpG island promoter regions (width 2 kb, 200 bp, and 20 nt). The peaks were searched for the known ZNF711 motif and the 5 nt motif identified by ChIP-exo. (E) Zoom-in comparison of peaks from ZNF711 standard ChIP-seq replicates and ChIP-exo replicates.

