Figure 7.
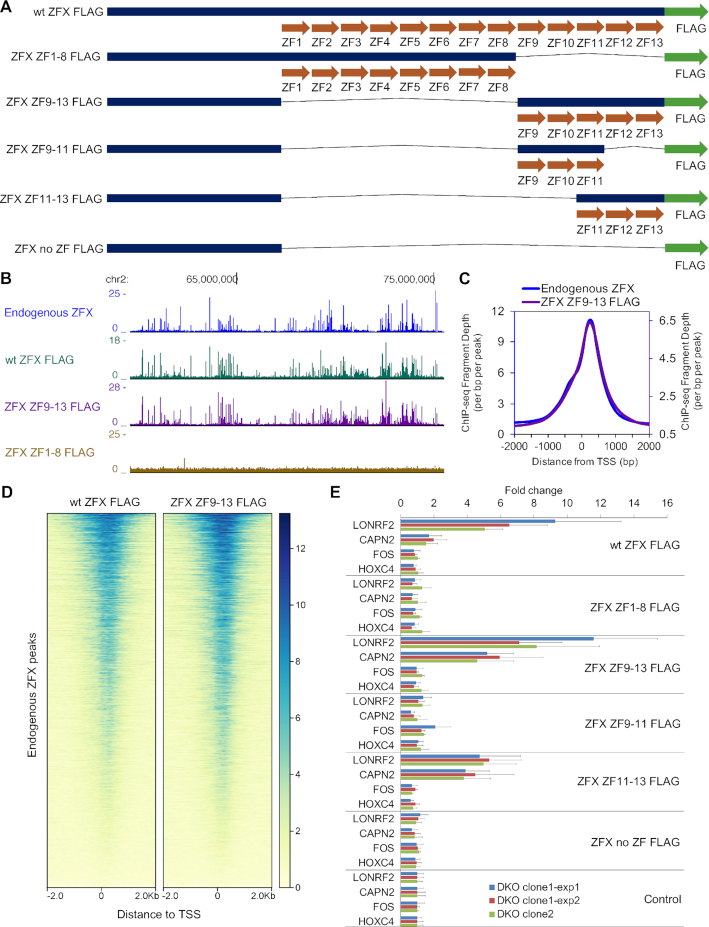
Functional analysis of the ZFX protein. (A) Schematic of FLAG-tagged ZFX zinc finger (ZF) mutant constructs. (B) Browser tracks showing genomic binding profiles of endogenous ZFX and FLAG-tagged wt ZFX and ZFX mutants in HEK293T cells. (C) Tag density plots of ChIP-seq peaks comparing endogenous ZFX and ZFX ZF9-13 peak locations in HEK293T cells. (D) Heatmaps showing ChIP-seq data from FLAG-tagged wt ZFX and ZFX ZF9-13 centered on the genomic locations of the endogenous ZFX peaks. (E) Expression levels following transfection with different ZFX constructs (as analyzed by RT-qPCR) of two genes (LONRF2 and CAPN2) whose promoters are bound by both ZFX and ZNF711 in wt HEK293T cells and which show a reduction in gene expression in all three DKO clones, of one gene (FOS) that is upregulated in all three DKO cells (a putative indirect target gene), and of one gene (HOXC4) that shows no expression changes in the DKO cells. Expression data were normalized to the control (cells transfected with an unrelated plasmid). Three independent experiments were performed using two different clonal populations of DKO cells; data points represent results from triplicate wells and duplicate PCR readings. Error bars indicate the pooled standard deviations of the means for the constructs and for the normalizing control.

