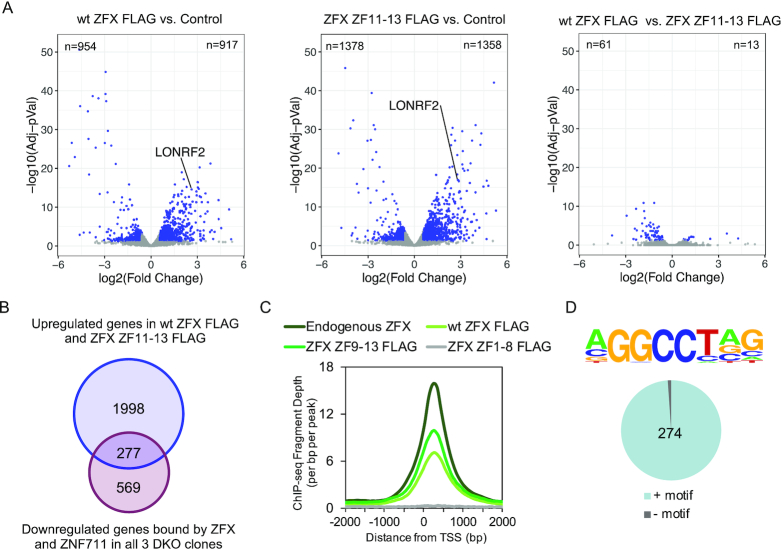
Figure 8.
ZFX ZF11-13 has very similar transcriptional activities as wt ZFX. (A) Volcano plots showing the differentially expressed genes (DEGs) identified via RNA-seq in comparisons of DKO cells 24 hr after transfection with FLAG-tagged wt ZFX vs. a control plasmid, FLAG-tagged ZFX ZF11-13 vs. a control plasmid, and FLAG-tagged wt ZFX vs. FLAG-tagged ZFX ZF11-13. (B) Shown is a Venn diagram comparing the 846 genes that are bound by ZFX and ZNF711 in wt HEK293T cells and show a decrease in mRNA levels in all three DKO clones and the 2275 genes that show increased levels in DKO cells transfected with either FLAG-tagged wt ZFX or ZFX ZF11-13. (C) Shown is a tag density plot of ChIP-seq data for endogenous ZFX, FLAG-tagged wt ZFX, ZFX ZF9-13, or ZFX ZF1-8 at the set of 277 responding promoters identified in panel B. (D) Motif coverage analysis of the 277 responding promoters.

