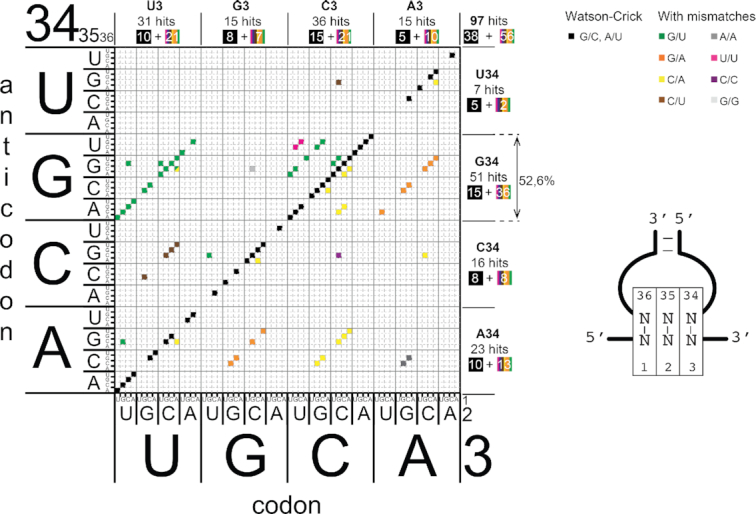
Figure 2.

Matrix representing the codon–anticodon combinations selected by the microfluidic pipeline. The sequences of the active codon–anticodon pairs that are efficiently recognized by the ribosome are plotted on a matrix. The 64 codons are represented on the x-axis and 64 anticodons are represented on the y-axis. The nucleotides of the codons are numbered 1, 2 and 3 from 5′ to 3′. The nucleotides of the anticodons are numbered 34, 35, 36 from 5′ to 3′ according to their position in tRNAs. The active codon–anticodon combinations are represented on the matrix by black squares (Watson–Crick pairs are along the diagonal) and by coloured squares for combinations containing mismatches that are parallel to the diagonal. The total number of hits is indicated on the upper right part of the matrix. The number of selected codon–anticodon pairs containing A, C, G and U at position 34 (anticodon) are shown on the right of the matrix. The number of selected codon–anticodon pairs containing A, C, G and U at position 3 (codon) are shown above the matrix. In each case, the number of hits is decomposed in those along the main diagonal (in black squares) and those off-diagonal (in rainbow squares).
