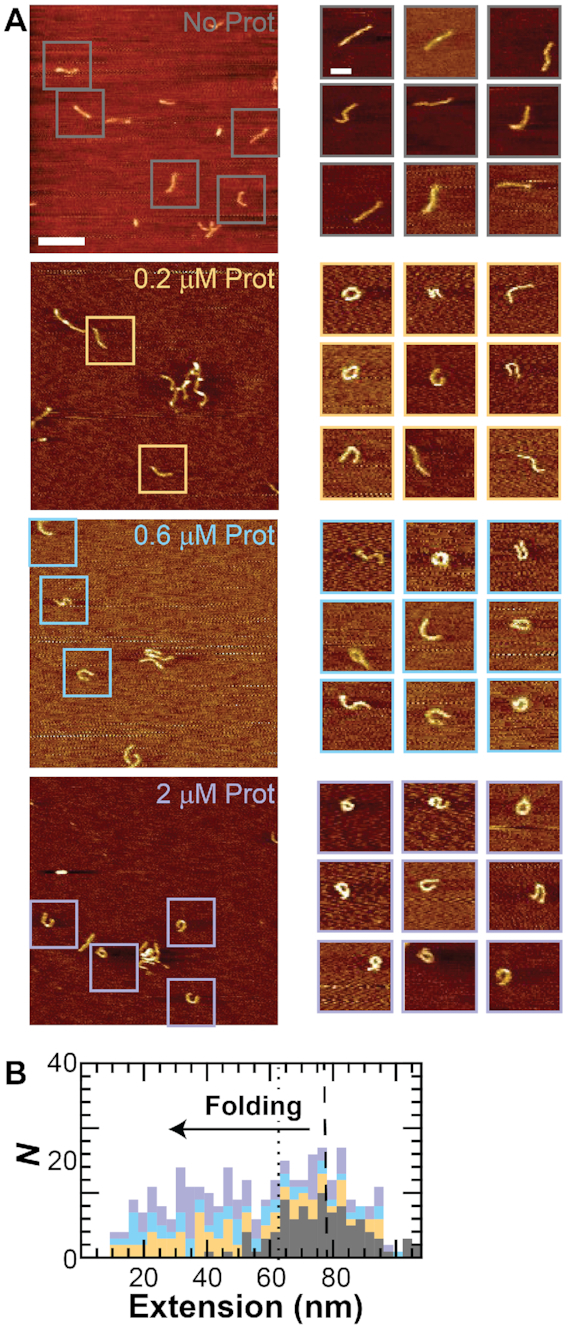
Figure 5.

Intermediate structures are partial loops. (A) (Left) AFM images of DNA (L = 105 nm) without protamine (gray) and with 0.2 μM (orange), 0.6 μM (blue), or 2 μM (purple) protamine show individual molecules (box). Scale bar is 200 nm. (Right) Representative individual molecules show unfolded and folded structures. The folded structures are loops and partial loops—c-shapes and s-shapes. Scale bar is 50 nm. (B) Computer algorithm calculates the end-to-end extension (inset) for all molecules that are not loops. Plot shows stacked histograms of the extension. Color scheme same as in A. Unfolded molecules have a mean extension of 77 nm (dashed line). Molecules that are in an intermediate folding state are defined as having a fractional extension of <0.6 (dotted line).
