Figure 1.
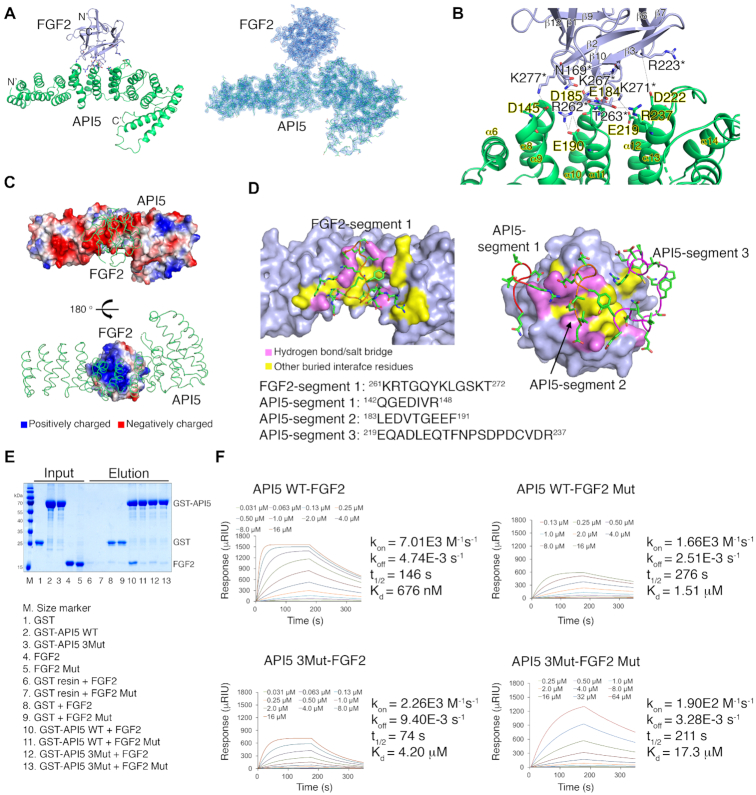
Crystal structure of the API5–FGF2 complex and validation of the API5–FGF2 interaction. (A) Left, overall structure of the API5–FGF2 complex. The N- and C-termini of each protein are indicated by N’ and C’, respectively. Structure of API5 are colored in green and the FGF2 structure are colored in light blue. Right, electron density map of the API5–FGF2 complex. (B) Detailed view of the protein-protein interaction interface. Residues participating in the hydrogen bonds and salt bridges in the protein interaction are shown. Residues of FGF2 are marked with asterisks. (C) Electrostatic surface potential of API5 and FGF2. Positively charged residues are colored in blue, negatively charged residues are colored in red, and neutral residues are represented in white. (D) Segments of FGF2 and API5 participating in the interaction. One major basic segment from FGF2 (FGF2-segment 1) and three major acidic segments from API5 (API5-segment1, API5-segment 2, and API5-segment3) participate in the protein-protein interaction. In the API5–FGF2 interaction interface, the residues involved in hydrogen bonding or salt bridges are colored in pink and other buried interface residues are colored in yellow. (E) GST pulldown with purified recombinant GST-API5 and His-FGF2. Protein bands were visualized by the Coomassie blue staining method. (F) SPR experiments with purified recombinant His-API5 and His-FGF2. The kon is the association rate constant (M−1 s−1), koff is the dissociation rate constant (s−1), t1/2 is the half-life of complex (s), and Kd is the equilibrium dissociation constant (M).

