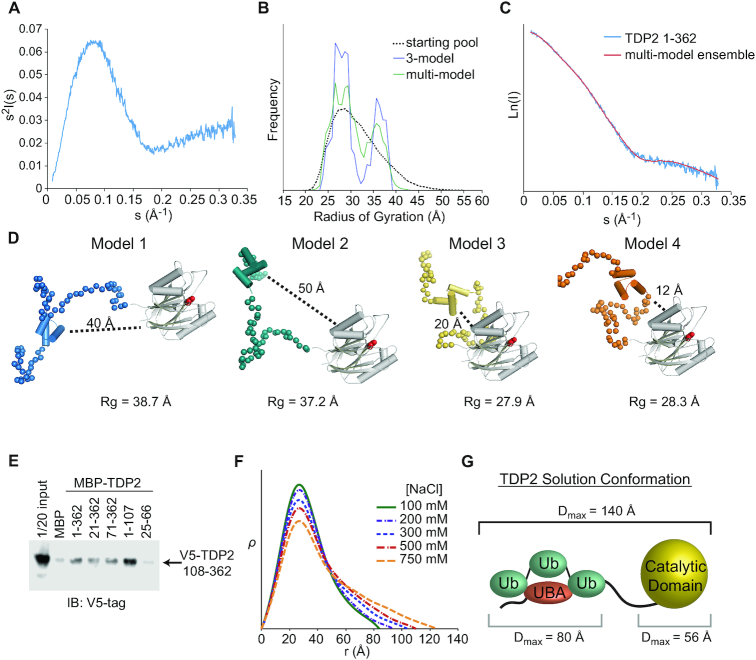
Figure 7.
The N-terminus of TDP2 interacts with the catalytic domain. (A) Kratky plot for TDP2 is typical of a predominantly folded protein with some disordered regions. (B) EOM using a 3-model or multi-model ensemble selects a pool of models containing both extended (Rg ∼ 37 Å) and compact (Rg ∼ 28 Å). (C) Comparison of scattering calculated from a multi-ensemble model is a good fit to the experimentally determined scattering intensity. (D) Example models selected by EOM contain two classes - those with the UBA domain distal (40–50 Å) or proximal (10–20 Å) to the catalytic domain. (E) in vitro pulldown assay with MBP-tagged TDP2 constructs and V5-tagged TDP2 catalytic domain (108–362) shows an interaction between the flexible N-terminus of TDP2 and catalytic domain in trans. (F) ρ(r) plots calculated from SAXS data collected from TDP2 in buffers with the indicated concentration of NaCl. Higher salt concentrations disrupt protein-protein interactions and weakens the UBA-catalytic domain interaction, resulting in a more extended conformation of TDP2. (G) Maximum particle dimension (Dmax) determined by SAXS are consistent with an extended conformation of the TDP2-Ub3 complex.

