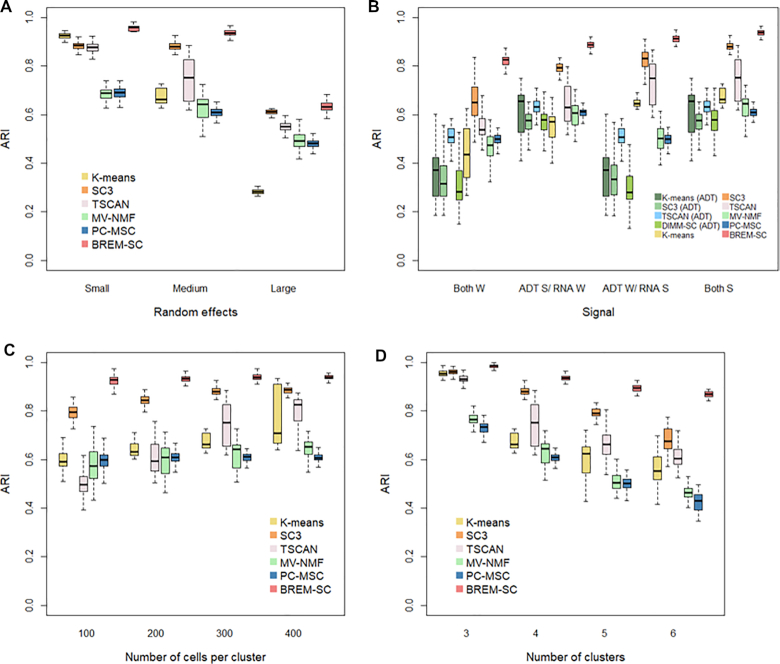
Figure 2.
Boxplots of ARIs for six clustering methods across 100 simulations, investigating how various among-cell variabilities (A), magnitude of cell type differences (B), (W refers to weak signals between clusters; S refers to strong signals), number of cells in each cluster (C) and number of clusters (D) affect the clustering results.

