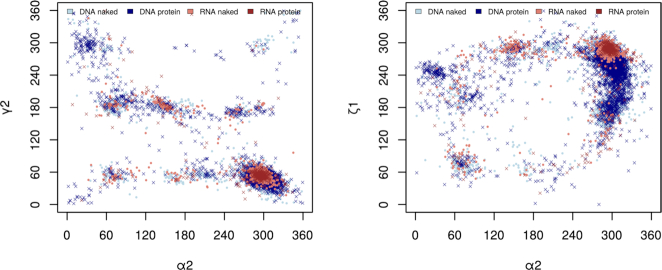
Figure 1.
Examples of two-dimensional scattergrams of three backbone torsion angles in RNA and DNA molecules. Shown are the values from crystal structures with resolution better than 1.8 Å. The scattergram on the left plots distributions of the torsions at the backbone bonds P-O5′ (axis α2) and C5′–C4′ (axis ɣ2), the scattergram on the right distributions of the torsions at the bonds P-O5′ (axis α2) and O3′-P (axis ζ1).

