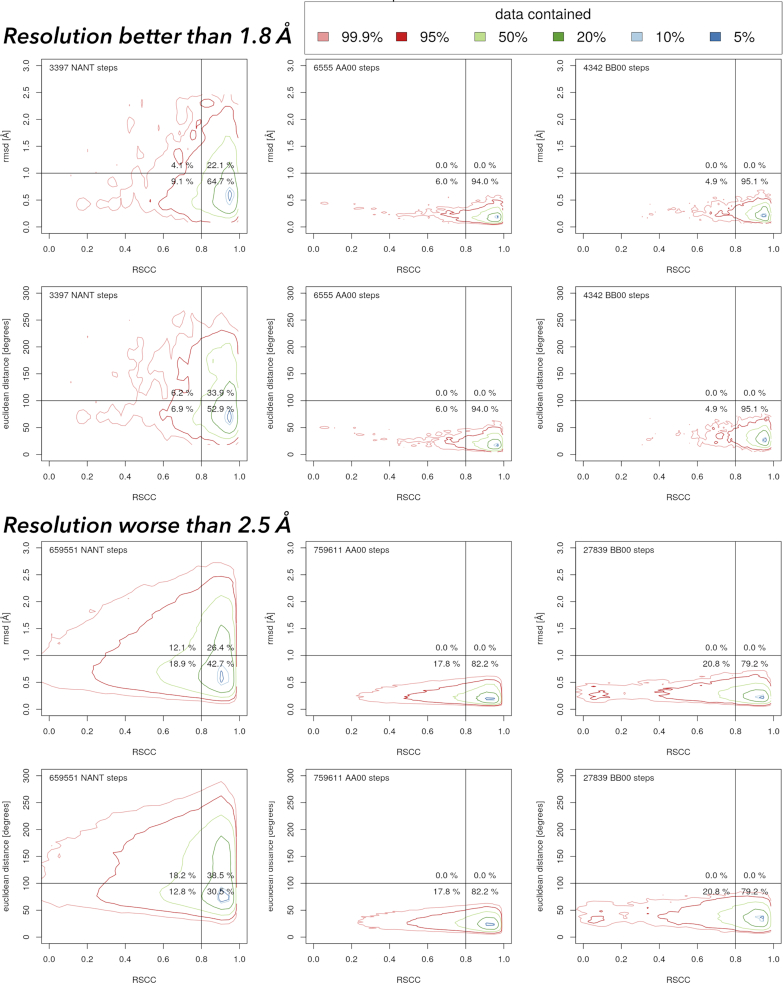
Figure 4.
Contoured scattergrams between real-space correlation coefficient (RSCC) and two geometric measures of the fit between the dinucleotide geometry and the geometry of the closest dinucleotide in the golden set. Data were calculated for 2.6 million dinucleotides in all nucleic acid structures in the PDB with available electron density maps as of 16 December 2019. The analogical scattergrams for all NtC classes are posted at the website dnatco.org/contours. The values of the rmsd values delimiting the quadrants are somewhat arbitrary but derived from the values of the assigned dinucleotides.

