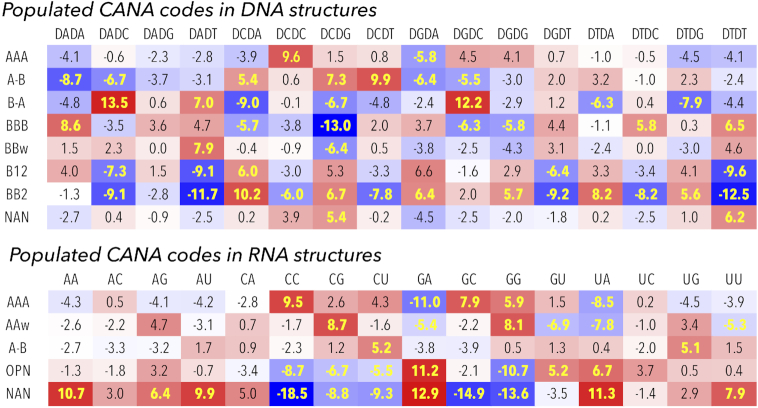
Figure 5.
Standardized Pearson residuals (SPR) of populated CANA codes for DNA and RNA analyzed structures calculated for the sixteen dinucleotide sequences. Red (blue) color highlights overpopulated (underpopulated) instances. SPR values highlighted in yellow point to the sequence/CANA combinations where χ2 values are highly significant (for the 15 degrees of freedom and the significance level of 0.01 χ2 > 30). SPR and χ2 values for all CANA codes are listed in supplemental Table S3E.

