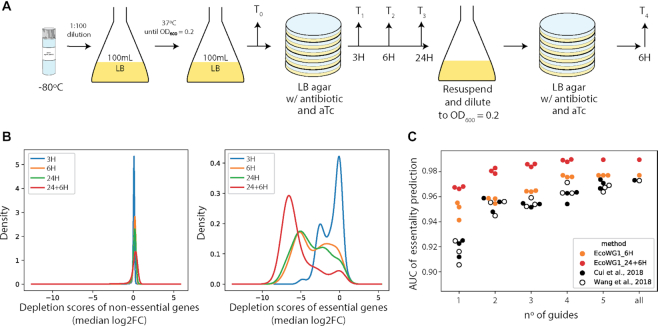
Figure 2.
Performance of the EcoWG1 library. (A) Experimental setup for the screen performed with the genome-wide EcoWG1 library in strain LC-E75 (MG1655 with dCas9 controlled by a Ptet promoter integrated at the 186 attB site). (B) Distribution of the depletion scores of non-essential and essential genes at the different time points of the experiment. The gene depletion score is computed as the median log2FC of the guides targeting the gene. (C) AUC of gene essentiality prediction using increasing numbers of randomly picked guides per gene in each dataset. Three random draws are shown for each dataset.

