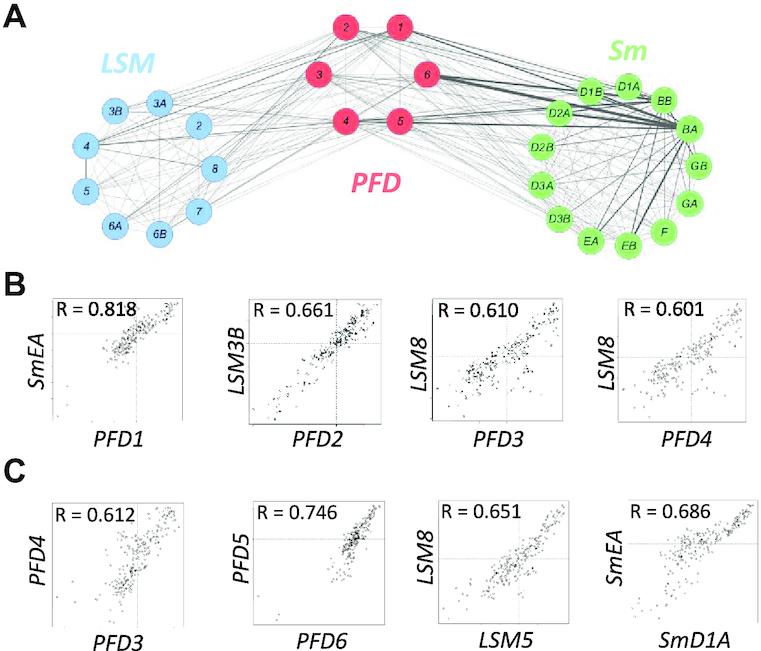
Figure 1.

Co-expression and physical interactions between PFDs and core spliceosome proteins. (A) Cytoscape representation of a co-expression network involving LSM, PFD and Sm genes. Co-expression is represented by mutual rank values. This value is directly proportional to the edge thickness. (B, C) Scatter plots comparing the expression level of several Sm or LSM genes with the expression of PFD genes (B) and between genes of the same complex (C) across several tissues and developmental stages. R indicates the Pearson correlation coefficient for each pair of genes.
