Figure 5.

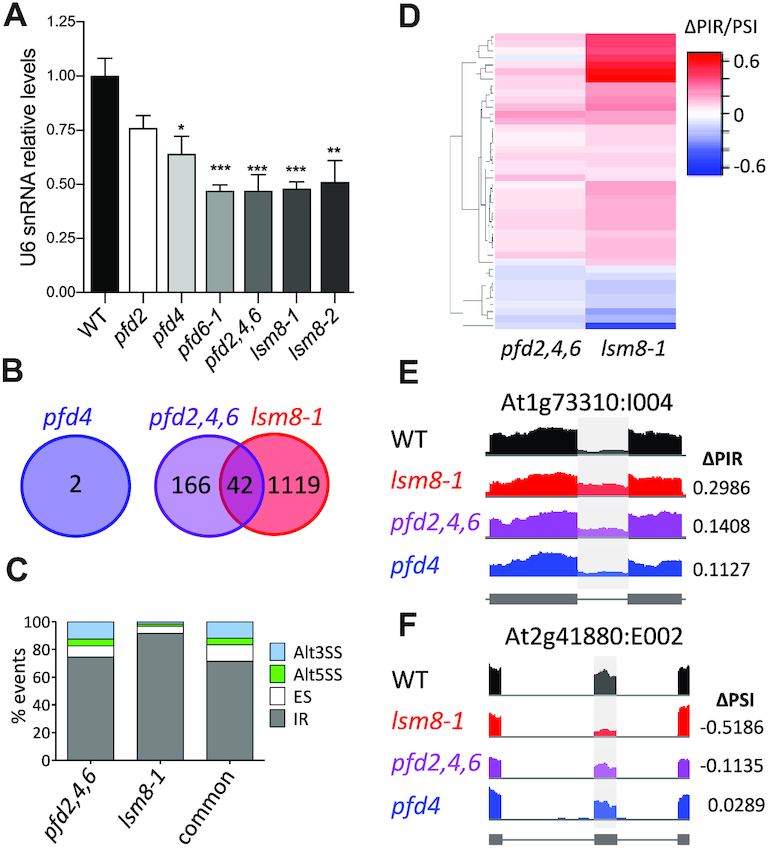
Genome-wide analysis of pre-mRNA splicing in pfd and lsm8-1 mutants by RNA-seq. (A) Relative U6 snRNA levels in pfd and lsm8-1 mutants grown in soil for two weeks. U6 snRNA levels were normalized against PP2AA3 mRNA. Data are average of three biological replicates. One, two, and three asterisks represent P < 0.01, 0.001 and 0.0001 in ANOVA tests, respectively. (B) Venn diagram showing the number of splicing events altered in the mutants. (C) Percentage of the different splicing events affected in each mutant and in both. Alt3SS and Alt5SS, alternative 3′ and 5′ splice site, respectively; ES, exon skipping; IR, intron retention. (D) Hierarchical clustering of common events by ΔPIR/PSI (percent intron retention/percent spliced-in) value. (E, F) IGV plots of altered splicing events: At1g73310:I004 (E) and At2g41880:E002 (F).
