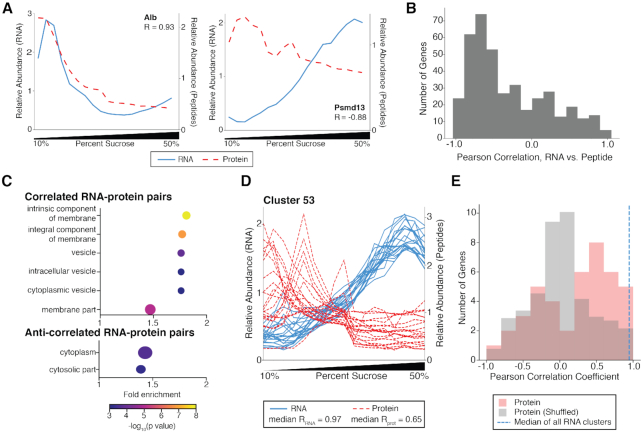
Figure 4.
Most RNAs are anti-correlated with the proteins they encode in the ATLAS-Seq gradient. (A) Normalized TPM (blue line) and peptide counts (red line) across the ATLAS-Seq gradient for Albumin (Alb, top panel), and 26S proteasome non-ATPase regulatory subunit 2 (Psmd2, bottom panel). Pearson correlation coefficients between RNA and protein are shown. (B) Distribution of Pearson correlation coefficients between RNAs and the proteins they encode across the ATLAS-Seq gradient for 404 genes. (C) Cellular compartment GO categories enriched in genes whose RNAs are strongly correlated with the proteins they encode. The size of each dot is determined by the number of genes (also listed next to point) found in that GO category. Fold enrichment was calculated by the observed number of genes in a GO category divided by the expected number of genes in that category (see Methods) (top panel). Cellular compartment GO categories enriched in genes whose RNAs strongly anti-correlate with the proteins they encode (bottom panel). (D) Normalized TPM (blue lines) and peptide counts (red lines) across the ATLAS-Seq gradient for genes with both ATLAS-Seq and mass spectrometry data in Cluster 53, which is enriched for proteasome genes. The median pairwise correlation among all RNAs and among all proteins in the cluster are listed. (E) Histogram of median pairwise correlations of protein profiles (red) for all clusters containing at least two proteins. Median pairwise correlations were also computed using shuffled RNA-protein assignments and plotted (gray). For reference, the median of all median pairwise RNA correlations across all RNA clusters is indicated in blue dashed line.

