Figure 5.

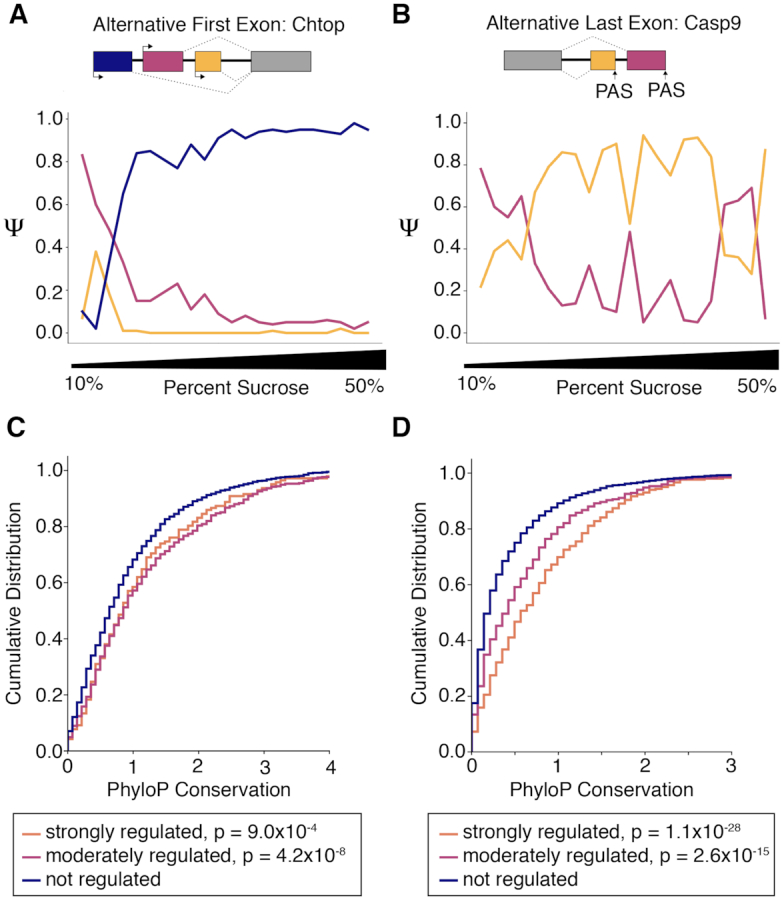
Alternative first and last exons exhibit differential profiles across the ATLAS-Seq gradient. (A) Ψ values across one ATLAS-Seq gradient for AFE isoforms of Chromatin target of PRMT1 protein, Chtop. (B) Ψ values across one ATLAS-Seq gradient for ALE isoforms of Caspase-9, Casp9. (C) Cumulative distribution of PhyloP conservation scores for AFE isoforms, separated by strongly regulated (ΔΨ > 0.5), moderately regulated (0.5 < ΔΨ > 0.25), and non-regulated (ΔΨ < 0.25) isoforms. P values were determined by Wilcoxon rank-sum test, comparing each regulated group to the non-regulated group. (D) Cumulative distribution of PhyloP conservation scores for ALE isoforms, similar to (C).
