Figure 6.
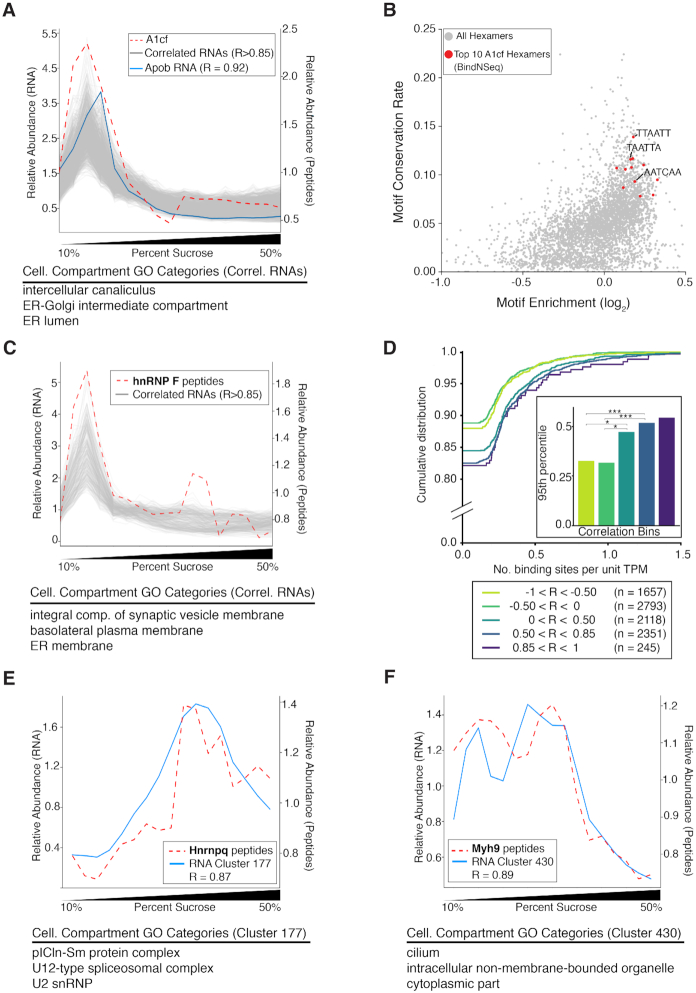
ATLAS-Seq reveals associations between RNA binding proteins and their RNA targets. (A) Distribution across the ATLAS-Seq gradient of relative peptide counts of APOBEC1 Complementation Factor (A1cf, red dashes), and normalized TPMs for apolipoprotein B (Apob, blue line). Pearson's R between A1cf and Apob = 0.92. Also shown are normalized TPMs for 894 RNAs correlating with a Pearson's R > 0.85 (gray). Shown below are GO Cellular Compartment terms associated with these RNAs. (B) Hexamers plotted by log2(foreground / background counts) on the x-axis and conservation rate on the y-axis, where foreground counts were obtained from 3′ UTRs in the set of 894 RNAs correlating > 0.85 from (A) and background counts were obtained from all other RNAs in the gradient. Conservation rate was computed across all mouse Refseq 3′ UTRs as fraction of instances showing full conservation across mouse, human, rat, and dog multi-alignments. The top 10 BindNSeq A1cf hexamers are highlighted in red. (C) Relative peptide counts for heterogeneous nuclear ribonucleoprotein F (hnRNP F, red dashes) and normalized TPMs for RNAs correlating with Pearson's R > 0.85 (gray). (D) Cumulative distribution of the number of hnRNP F CLIP binding sites per unit TPM for groups of RNAs separated by Pearson's correlation to relative abundance of hnRNP F peptides. *P < 0.05, **P < 0.001 as assessed by Wilcoxon rank-sum test. (E) Relative peptide counts for heterogeneous nuclear ribonucleoprotein Q (hnRNP Q/Syncrip, red dashes) and mean TPM profile for the RNA cluster best correlating with hnRNP Q peptide counts (blue line). Shown below are GO Cellular Compartment terms enriched in that cluster. (F) Relative peptide counts for Myosin-9 (Myh9, red dashes) and mean TPM profile for the RNA cluster best correlating with Myh9 peptide counts (blue). Shown below are GO Cellular Compartment terms enriched in that cluster.

