
Figure 1.
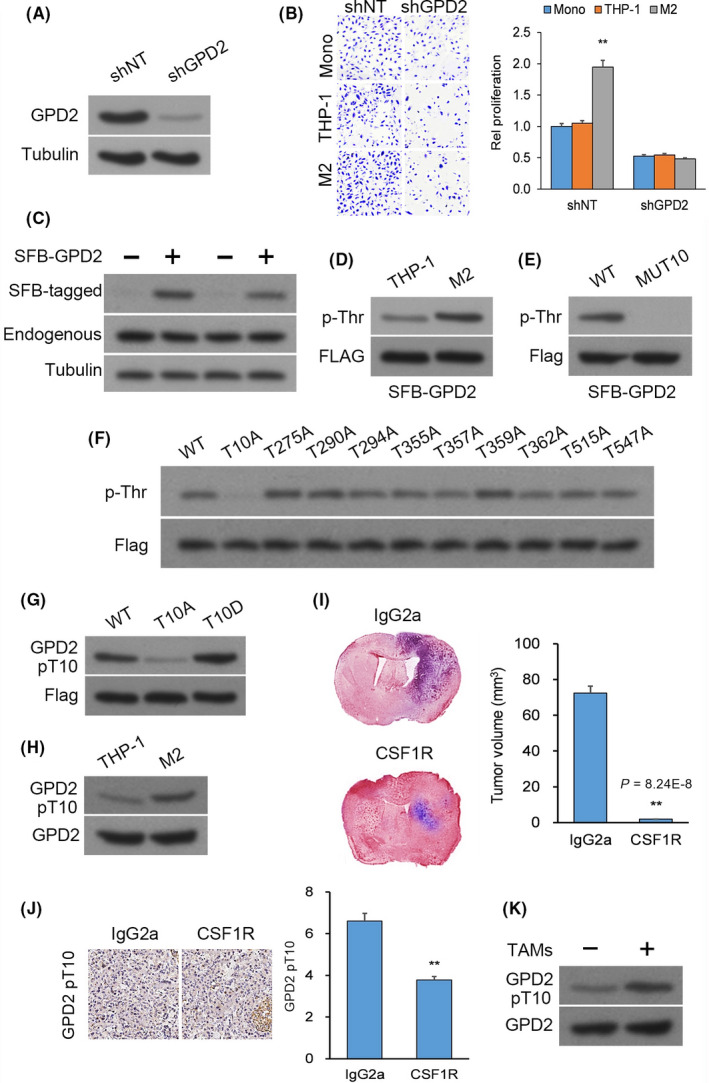
Macrophages induce glycerol‐3‐phosphate dehydrogenase (GPD2) phosphorylation at T10. A, Western blot (WB) of U‐87 cultures transfected with lentiviral shGPD2 or scrambled control (shNT). B, Cellular proliferation by crystal violet of U‐87 cells with stable transfection of shGPD2 or shNT in mono–culture or co–culture with THP‐1 cells or M2 cells at seven days. C, WB of U‐87 and U‐251 cultures with stable transfection of S‐FLAG‐streptavidin‐binding peptide (SFB)‐tagged GPD2. D, Pull‐down assay (PD) with streptavidin beads from U‐87 cultures with stable transfection of S‐FLAG‐streptavidin‐binding peptide (SFB)‐GPD2 co–cultured for 24 h with M2 or THP‐1 cells. E, PD with streptavidin beads from U‐87 cultures with stable transfection of wild‐type (WT) SFB‐GPD2 or mutant SFB‐GPD2‐MUT10. F, PD with streptavidin beads from U‐87 cultures with stable transfection of the 10 individual SFB‐GPD2 Phosphosite mutants. G, WB of U‐87 cultures with stable transfection of WT SFB‐GPD2, mutant SFB‐GPD2‐T10A, or mutant SFB‐GPD2‐T10D. H, Immunoprecipitation (IP) from U‐87 cells co–cultured with M2 or THP‐1 cells. n = 3 technical replicates × 3 biological replicates. I and J, Orthotopic GL261 gliomas generated in C57BL/6 mice by intracranial injection. Animals were given anti–colony stimulating factor 1 receptor or control IgG2a antibodies (n = 9 animals per cohort) and killed 14 d post–implantation. I, Left top panel: Typical H&E‐stained brain tumor tissue sections; Left bottom panel: Magnified (100×) image of tumor boundary; Right panel: Quantification of tumor size (V) by length (l) and width (w) determined by V = 0.5 × l × w2; n = 9. J, Left panel: Typical IHC‐stained brain tumor tissue sections for GPD2 pT10; Right panel: Semi‐quantification of GPD2 pT10 staining using scores ranging from 0 to 8; n = 9. K, IP from U‐87 cells co–cultured for 24 h with/without patient‐derived CD11b+/CD163+ tumor‐associated macrophages (TAM). *P < 0.05, **P < 0.01 (t test). Means ± standard errors of the mean (SEM). Please refer to Figure S1 for further details