
FIGURE 4.
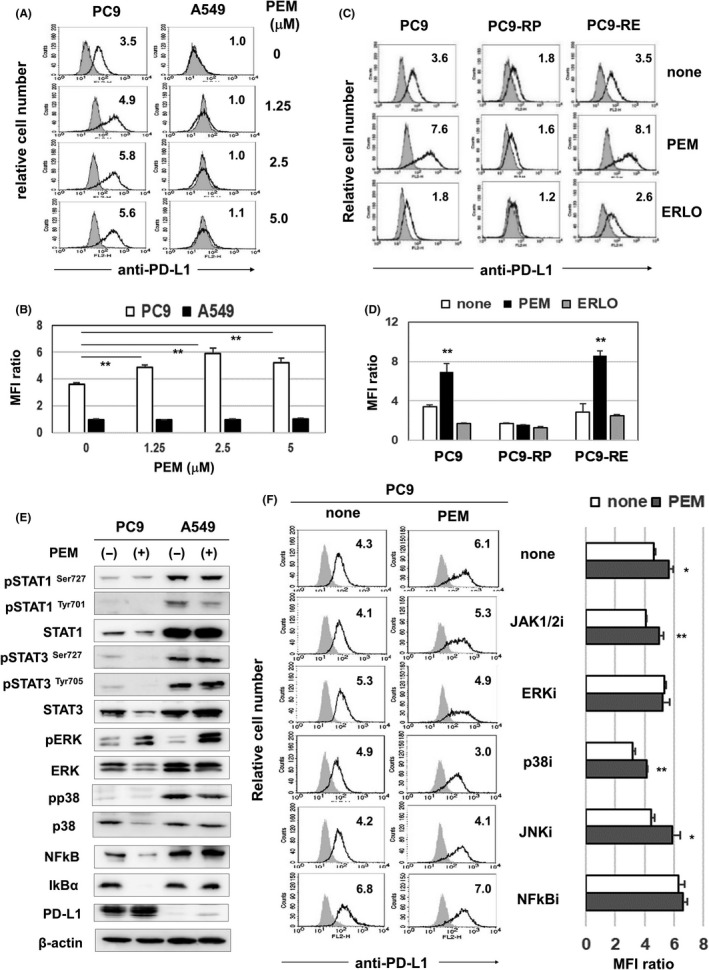
Pemetrexed (PEM) increases the expression of programmed death‐ligand 1 (PD‐L1) on PC9 cells. A, Cancer cells were cultured with the indicated doses of PEM for 2 d. After harvesting, these cells were analyzed by flow cytometry. The bold line indicates staining with PE‐conjugated anti–PD‐L1 antibody, and the gray background indicates staining with isotype‐matched PE‐conjugated mouse IgG. The number represents the mean fluorescence intensity (MFI) ratio. B, The results from three samples are shown. **P < 0.01. C, PC9, PC9‐RP and PC9‐RE cells were cultured with PEM (3 µmol/L) or ERLO (0.5 µmol/L) for 2 d. After harvesting, these cells were analyzed by flow cytometry. The number represents the MFI ratio. D, The results from three samples are shown. **P < 0.01. E, Cancer cells were cultured with PEM (2 µmol/L) for 2 d. Using lysates, the expressions of the indicated proteins and phosphorylated proteins were examined with the indicated antibodies. β‐actin was measured as a control. F, PC9 cells were cultured with PEM (2 µmol/L) for 2 d. The dose of the NFκB inhibitor was 0.5 µmol/L, and the dose of other inhibitors was 4 µmol/L. After harvesting, these cells were analyzed by flow cytometry. Left: The number represents the MFI ratio. Right: The results from three samples are shown. *P < 0.05. ** P < 0.01