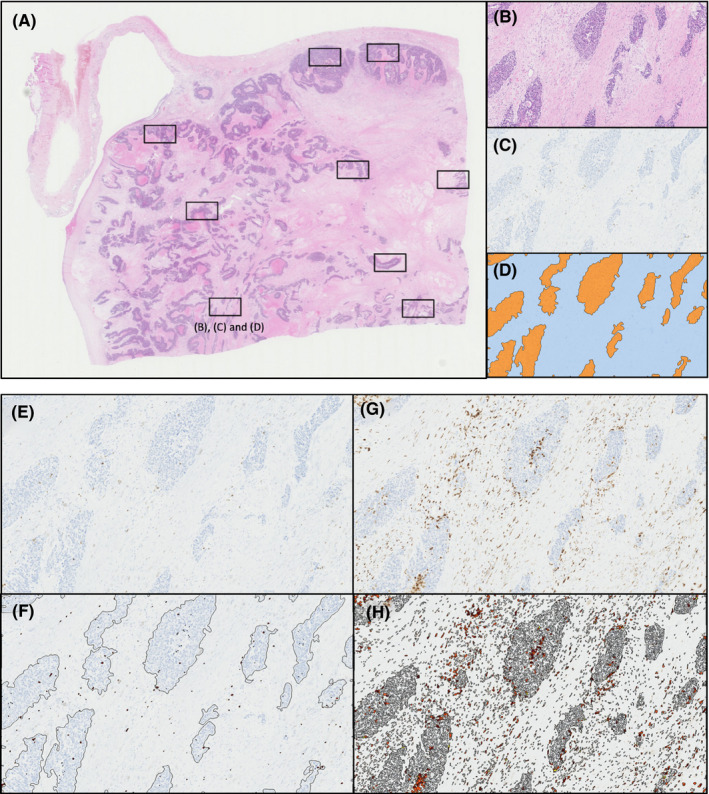
FIGURE 1.

Representative images of selected areas from each specimen. A, Area detection image of H&E. B, Representative image of tumor islet and stroma of H&E. C‐D, CD8+ cell density. D, Orange‐colored area represents tumor islet and blue‐colored area represents stroma. E‐H, Positive immune cells of CD8+ as representative images of immune factors: relatively low frequency in (E) and (F); high frequency in (G) and (H)
