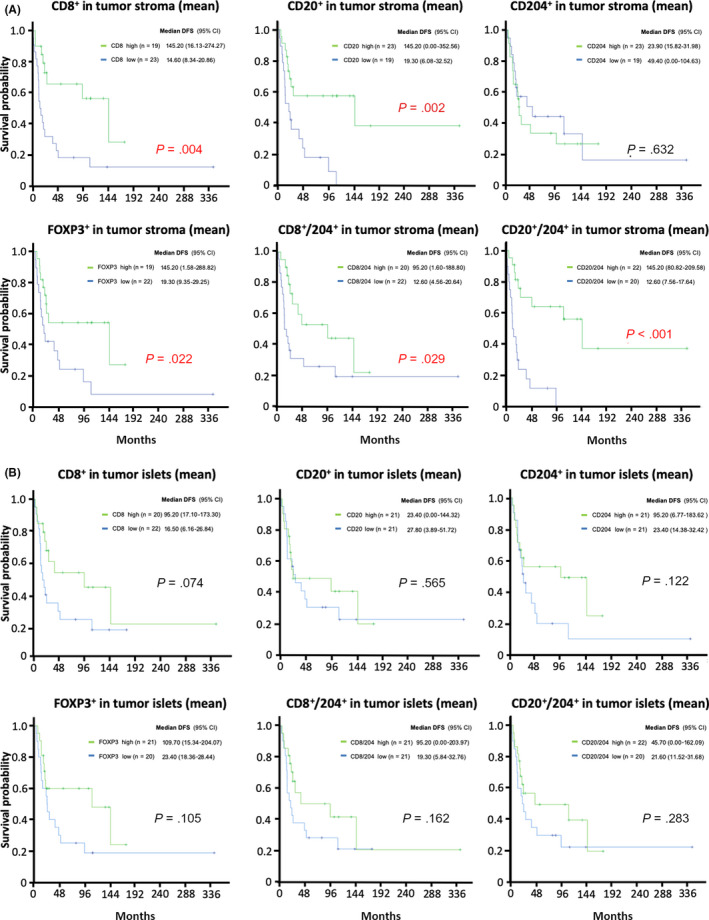
FIGURE 2.

Kaplan‐Meier curves of tumor‐infiltrating immune cells. Kaplan‐Meier curves of CD8+, CD20+, CD204+, FOXP3+, and the ratio of CD8+ to CD204+, and CD20+ to CD204+ in (A) stroma (mean) and (B) islets (mean) are shown. CI, confidence interval; DFS, disease‐free survival
