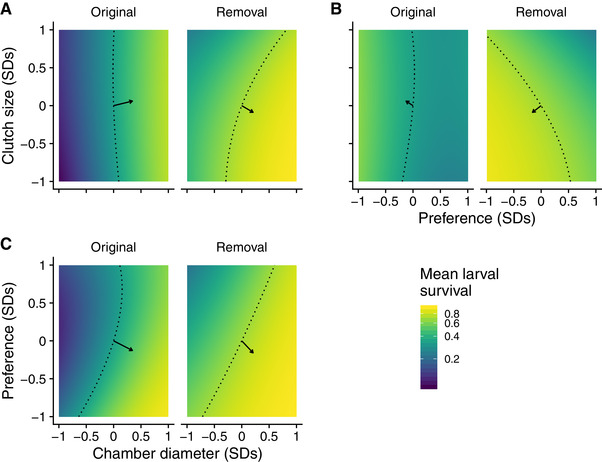
Figure 3.

Two‐dimensional view of fitness landscapes of gall midge phenotypes in the original food web and with the removal of larval parasitoids. Each panel corresponds to a different combination of phenotypic traits: clutch size and chamber diameter (A); clutch size and oviposition preference (B); oviposition preference and chamber diameter (C). Arrows represent mean estimates of directional selection gradients, while dotted lines represent predicted larval survival of the mean phenotype in each food‐web treatment. Note that arrows point more toward a corner of the fitness landscape for each combination of traits with the removal of larval parasitoids compared to the original food web. This indicates that the removal of consumers more strongly favored a specific combination of traits. Note that mean larval survival is plotted on a natural log scale to reflect the mathematical definition of the fitness landscape.
