
FIGURE 1.
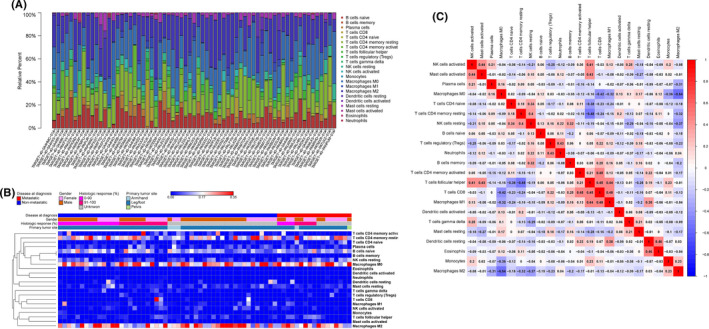
The landscape of infiltrating immune cells in osteosarcoma (OS). A, Bar plot of the fractions of 22 immune cell types in OS from TARGET database, with CIBERSORT P < 0.05, n = 80. B, Heat map of infiltrating immune cells from TARGET database, on a blue–red scale indicated in the color key. C, Correlation matrix of the densities of 22 immune cells in the TARGET cohort