
FIGURE 5.
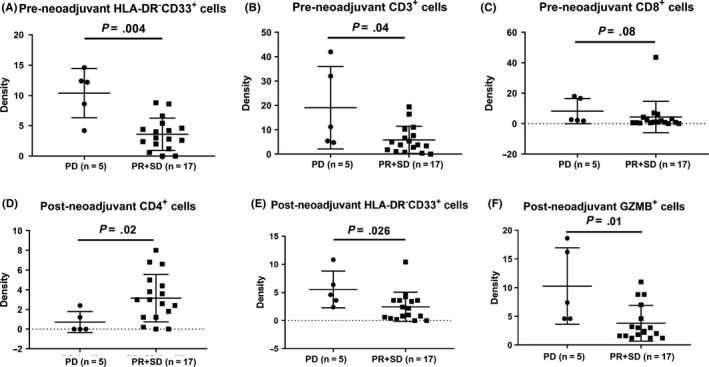
Comparison of the densities of tumor‐infiltrating immune cells in responders (partial response [PR] and stable disease [SD]) and non‐responders (progressive disease [PDf]). A‐C, Analysis in pre–neoadjuvant specimens, including myeloid‐derived suppressive cells (MDSC; HLA‐DR‐CD33+), CD3+ and CD8+ cells. D‐F, Results in post–neoadjuvant specimens, including CD4+, MDSC and GZMB+ cells. P‐values are calculated using the Wilcoxon test