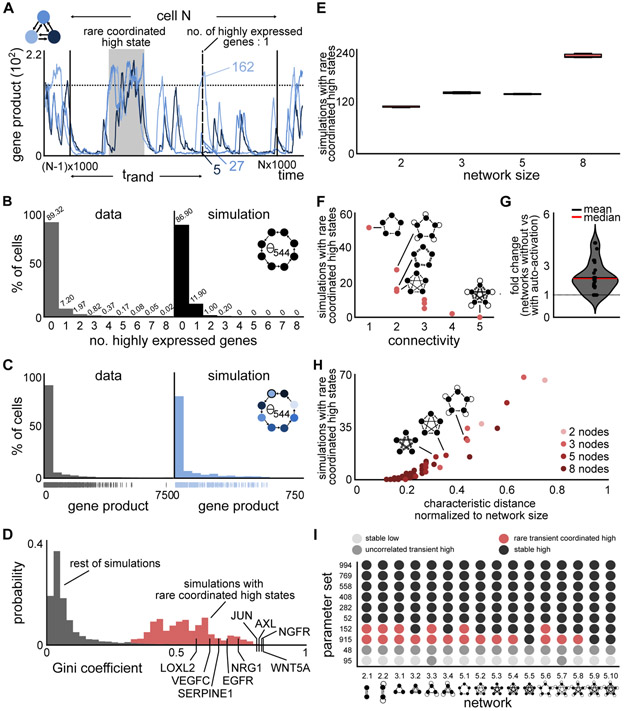
Figure 2. Simulations of the transcriptional bursting model show similar behavior at the population level as the drug naive melanoma cells.
(A) Frame of simulation showing rare coordinated high state (shaded area). The 1,000,000 time unit simulation is split into frames of 1,000 time units to create a simulated cell population (shown for cell N). For a randomly determined time-point trand, the number of simultaneously highly expressed genes and the gene count per gene per cell are evaluated. The network of the corresponding simulation is given in the top left corner.
(B,C) The simulated number of simultaneously highly expressed genes and expression distribution at the population level are qualitatively similar to experimental data from a drug naive melanoma population (data from (Shaffer et al., 2017)). The percentages are indicated above the histogram (in B). The network and parameter set as well as the particular node (in C) used for comparison are shown in the right panel.
(D) The Gini indices of simulations of rare coordinated high states are substantially higher than of simulations not showing rare coordinated high states. The experimentally measured expression distributions have similar Gini indices than simulations with rare coordinated high states.
(E) Total number of rare coordinated high states were extracted for simulations of different networks sizes, containing either 2, 3, 5, or 8 nodes to see if they occur across networks of different sizes. Rare coordinated high states were found to exist ubiquitously across all possible networks of all analyzed network sizes. The measurements were performed via three independent and randomly sampled trand (median, 25th and 75th percentiles).
(F) The frequency of rare coordinated high states depends on the network connectivity, which is defined as number of ingoing edges for any node of the network. Shown here is the dependence for all 5-node networks, such that increasing connectivity within all 5-node networks leads to a decrease in the number of simulations with rare coordinated high states. Each dot represents a particular network topology within the possible space of 5-node networks.
(G) Effect of adding auto-activation (self-loop) to networks on the number of simulations with rare coordinated high states. Networks with auto-activation exhibit simulations with rare coordinated high states less frequently than the same networks without auto-activation. Fold-change is calculated by dividing the number of simulations with rare coordinated high states for networks containing auto-activation with the number of simulations with rare coordinated high states for the same networks without auto-activation. Each dot represents one of the 96/2 = 46 direct network comparisons. Network comparisons where one of the networks did not give rise to simulations with rare coordinated high states were discarded.
(H) The frequency of simulations with rare coordinated high states depends on the characteristic distance, defined as the average shortest path length between pairs of nodes of the network. With increasing characteristic distance (normalized to network size), more simulations show rare coordinated high states. Each dot represents the characteristic distance of one of the 96 networks. Each network size is represented by a unique color.
(I) The frequency of occurrence of simulations with rare coordinated high states is dependent on the choice of model parameters. Specifically, simulations of a particular parameter set across different networks and sizes show largely the same class of gene expression profiles. Each row corresponds to specific parameter sets within the space of all parameter sets analyzed. Each column name corresponds to a particular network, and the underlying network is drawn below the column name.

