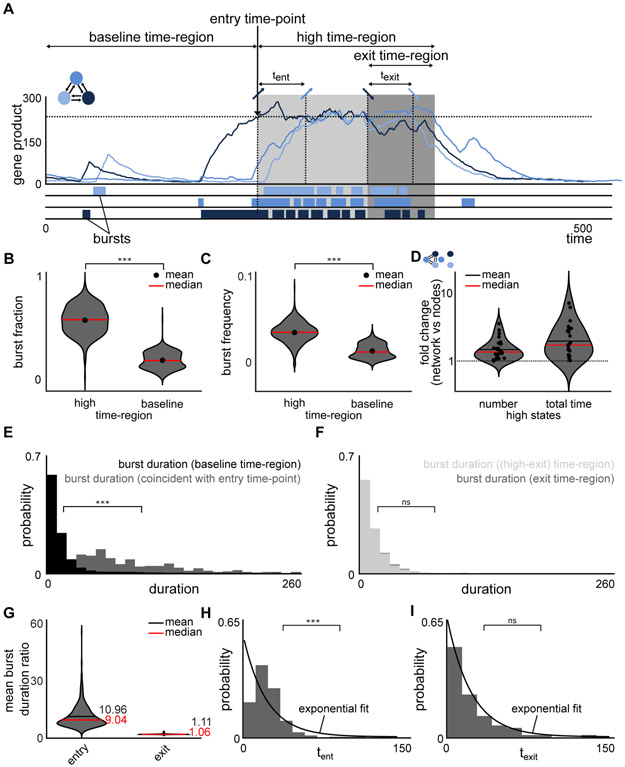
Figure 4. Rare coordinated high state is initiated by a long transcriptional burst, maintained by an increase in burst frequency and terminated according to a random process.
(A) An exemplary high region, with a baseline time-region, entry time-point, high time-region and an exit time-region. The time intervals for an additional gene to enter and exit the high region are marked by tent and texit, respectively. The bursts below the exemplary simulation are representative schematics.
(B) Burst fraction, defined as the number of time points the system is in a burst divided by the total number of time points, was calculated for baseline time-region and high time-region for all (n = 594) simulations that produce rare coordinated high states and compared them using violin plots. The burst fraction is significantly higher in the high time-region as compared to the baseline time-region (two-sample Kolmogorov-Smirnov test, p-value < 0.001), implying that enhanced transcriptional activity facilitates the maintenance of rare coordinated high states.
(C) Burst frequency, defined as the number of bursts divided by the total number of time points, was calculated for baseline time-region and high time-region for all (n = 594) simulations that produce rare coordinated high states and compared them using violin plots. The frequency of transcriptional bursts is increased in the high time-region (two-sample Kolmogorov-Smirnov test, p-value < 0.001), implying that enhanced transcriptional activity is caused by more frequent bursts rather than prolonged bursts.
(D) Violin plots of the fold change in number of high states and total time spent in high states for network 3.2 and its unconnected graph. Positive regulatory interactions between the connected nodes (network) leads to an increased number of and total time in high states in comparison to independent nodes. Fold-change is calculated by dividing the number of high states (total time spent in high states) for network 3.2 with the number of high states (total time spent in high states) for the unconnected graph. Each dot represents one of the 26 simulations showing rare coordinated high states for network 3.2.
(E) Distributions of burst duration in the baseline time-region (black) and those coincident with entry time-point (gray) (see Figure 4A). The bursts coincident with entry time-points are significantly longer than bursts in the baseline time-region (two-sample Kolmogorov-Smirnov test, p-value < 0.001).
(F) Distributions of burst duration in the high time-region but not the exit time-region ((high-exit) time-region) (light gray) and those in the exit time-region (dark gray) (see Figure 4A). There is no statistically significant difference between the distributions underlying the duration of bursts in the high time-region and the exit time-region (two-sample Kolmogorov-Smirnov test, p-value > 0.05).
(G) Violin plots of the mean burst duration ratios for entry and exit (nentry= nexit = 594), where mean burst ratio represents the difference in means of the burst duration distributions (see FigureE-F) per simulation for all simulations with rare coordinated high states. Ratio close to 1 suggests no difference between the two regions. While the mean (and median) burst duration ratio between entry time-point and baseline time-region is considerably increased, the mean (and median) burst duration ratio between bursts in the exit time-region and in the rest of the high time-region are comparable for all simulations with rare coordinated high states.
(H,I) Distributions of the time intervals between genes entering (H) and exiting (I) the high time-region, denoted by tent and texit respectively in Figure 4A, are distributed differently for two representative simulations. While the time intervals for entering (tent) the high time-region are not exponentially distributed (H) (and hence not random), the time intervals for exiting (texit) the high time-region are exponentially distributed (I) (Lilliefors test, p-value < 0.001 and > 0.05, respectively).
See also Figure S7.

