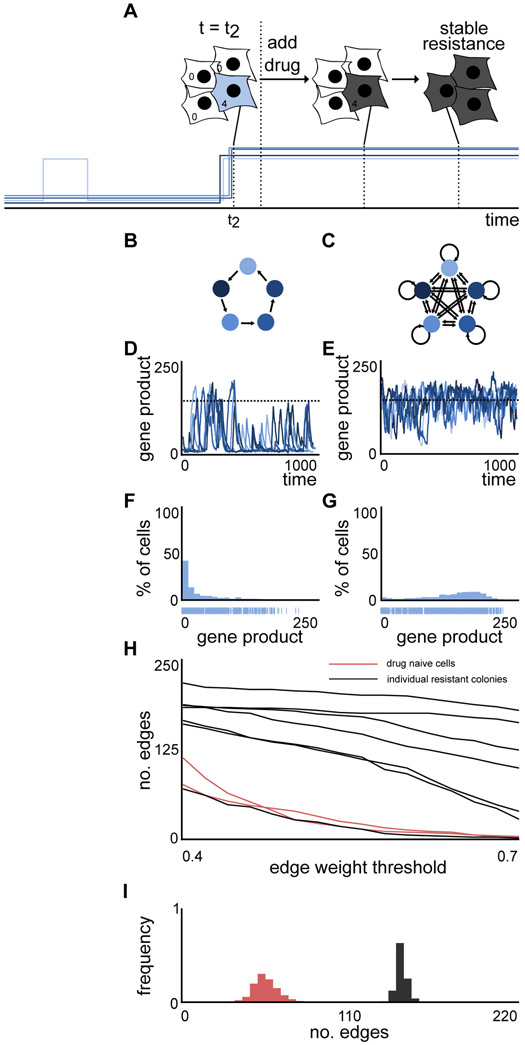
Figure 5. Increased connectivity of a network leads to stable high expression which is also observed in emerging resistant colonies post-drug treatment.
(A) Upon drug treatment, the surviving cells acquire stable resistance. A schematic gene expression pattern is shown below.
(B,C) Networks of size 5 with low (B) (1) and high (C) (5) connectivity and corresponding (D,E) simulations.
(F,G) The expression distributions are determined by taking the counts of simulated gene products per 1000 time units (see Figure 2A) of simulations (D,E) corresponding to the lowly (B) and highly (C) connected networks. The gene expression distribution of the highly connected network (G) does not exhibit heavy-tails while the simulation of the lowly connected network (F) exhibits heavy-tails.
(H) Comparison of the connectedness of the underlying inferred gene regulatory networks of drug naive cells and resistant colonies (post drug treatment) using the Phixer algorithm for network inference analysis. Total number of edges is calculated for different edge weight thresholds, defined as the threshold at which an inferred edge is assumed to be present in the inferred gene regulatory network. For all the edge weights investigated, six out of seven resistant colonies have inferred gene regulatory networks with higher numbers of edges than drug naive cells, suggesting that the gene regulatory networks underlying resistant colonies are more strongly connected.
(I) Applying the network inference analysis 1000 times for a fixed edge weight threshold of 0.45 gives distributions for the number of edges in the inferred gene regulatory networks for both drug naive cells (red) and resistant colonies (black) (distributions shown for one example each). The distribution of number of edges in the inferred gene regulatory network is considerably increased for the resistant colony.
See also Figure S8.

