
Figure 3. Peptide 2 drastically reduces the rate of Aβ42 fibril elongation.
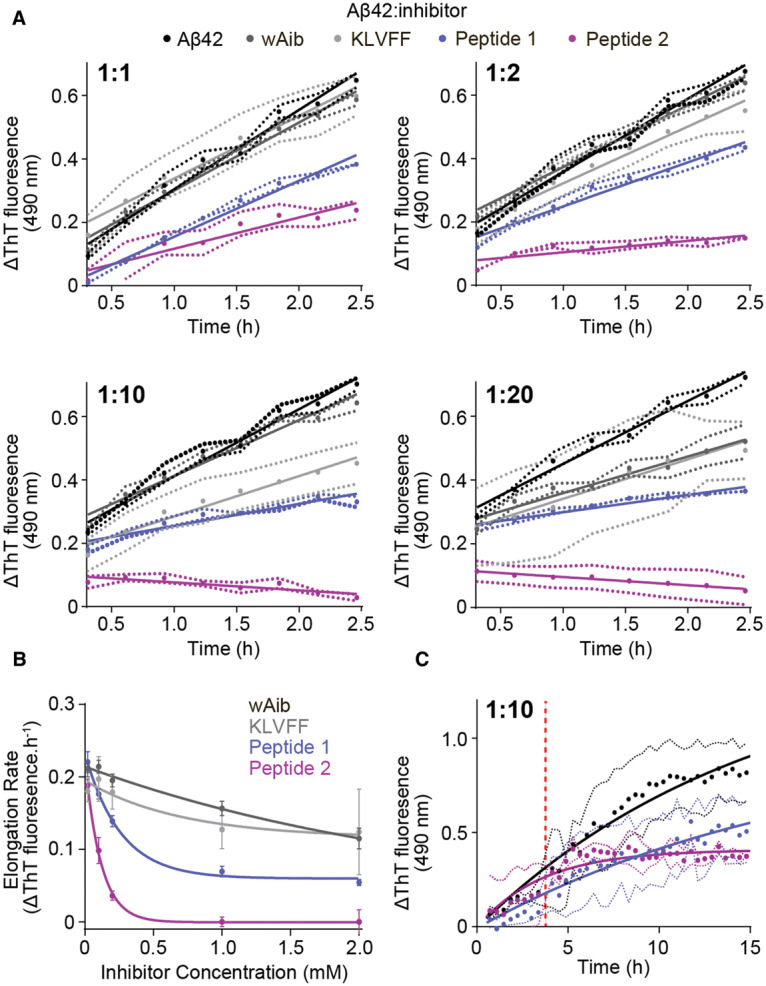
(A) The change in ThT fluorescence during the elongation phase of Aβ42 (100 µM) fibril formation in the absence (black) and presence (grey, blue and purple) of inhibitors at a range of molar ratios (0–2.5 h from Figure 2A). (B) The rate of Aβ42 fibril elongation as a function of inhibitor concentration (mM) was fitted with a non-linear one-phase decay fit. (C) ThT fluorescence assay of Aβ42 (10 µM) spiked after 4.5 h (red dashed line) with peptides 1 and 2 (100 µM) during incubation where no decrease in fibrilization was observed. Data reported is presented as mean ± SEM (n = 3).