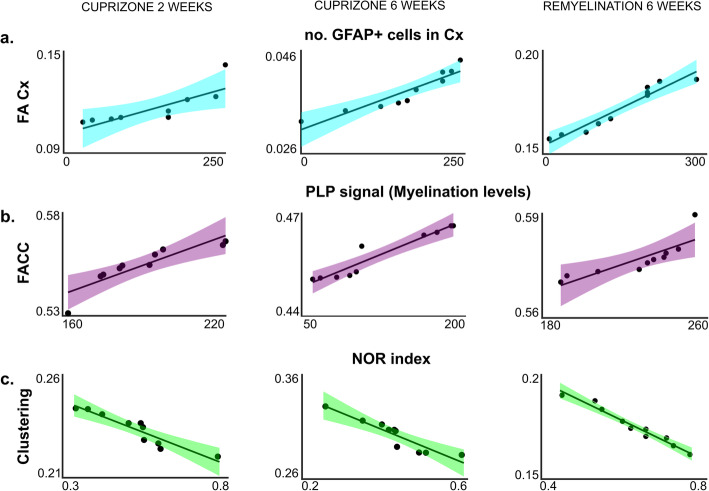
Fig. 6.
Correlation analyses. a Correlation plots between FA values in the cortex and number of GFAP positive cells found in the cortex. Three time points corresponding to onset of demyelination (cupri 2 weeks, left column), full demyelination (cupri 6 weeks, middle column), and full remyelination (remy 6 weeks, right column). b Correlation plots between FA values in the corpus callosum and PLP signal intensity (indication for myelination) in the corpus callosum. Three time points corresponding to the start of demyelination (cupri 2 weeks, left column), full demyelination (cupri 6 weeks, middle column), and full remyelination (remy 6 weeks, right column). c Correlation plots between clustering (indicator of network activity) and the NOR index. Three time points corresponding to the start of demyelination (cupri 2 weeks, left column), full demyelination (cupri 6 weeks, middle column), and full remyelination (remy 6 weeks, right column). r2 and p values are given in Table 1

