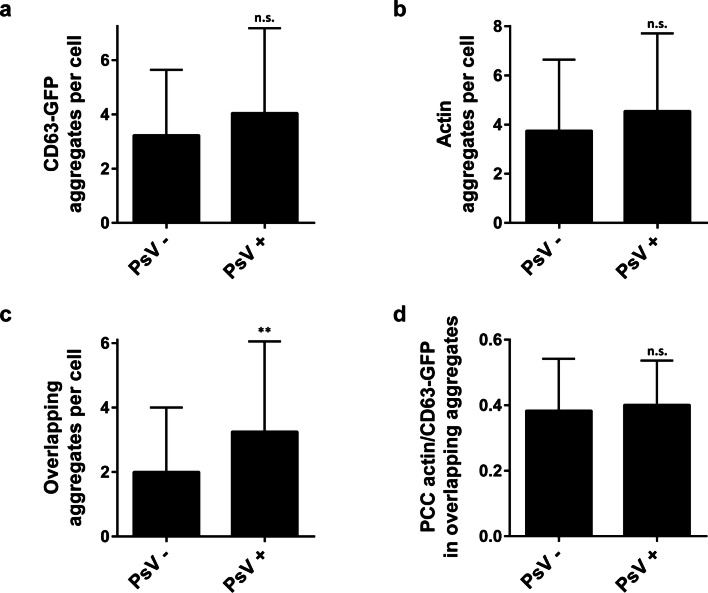
Fig. 2.
Quantification of CD63/actin positive aggregates in PsV treated and untreated HaCaT cells. The number of CD63 aggregates (a), actin aggregates (b), and of aggregates with overlapping CD63 and actin signals (c), which are a subset of (a) and (b), was counted manually in cells as shown in Fig. 1. d Regions of interest (ROIs) were placed on CD63/actin aggregates from PsV treated and untreated cells and the Pearson correlation coefficient (PCC) within the ROIs was calculated. Values are given as means ± SD (For a–c: n = 59–60 basal membranes collected from 3 biological replicates; for d: n = 120–195 overlapping aggregates as counted from c). **p < 0.01; n.s. not significant (unpaired Student’s t-test, comparing PsV treated to untreated cells)

