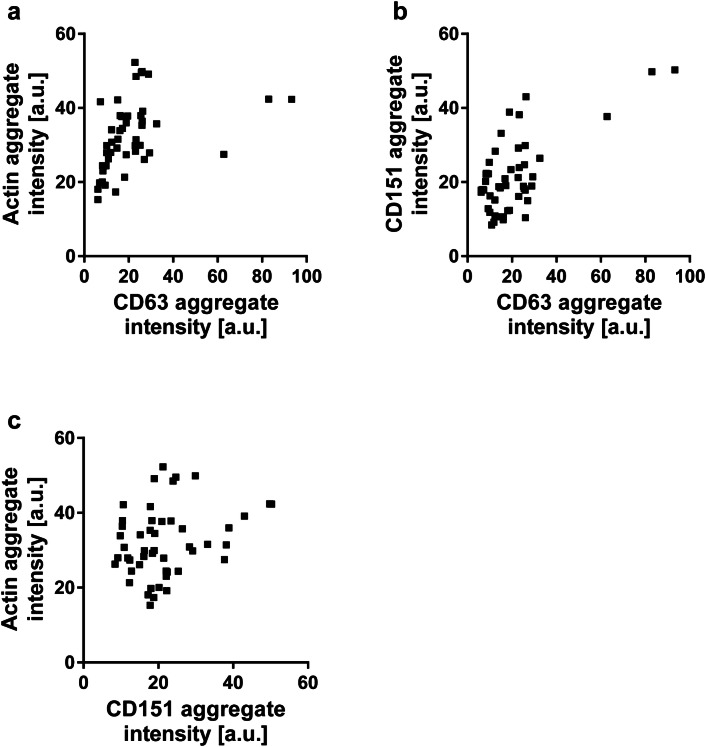
Fig. 4.
Relationship between the intensities of CD63, CD151 and actin aggregates. The intensities of actin and CD63 (a), CD151 and CD63 (b) and actin and CD151 (c) aggregates recorded from the basal layer, as shown in Fig. 3, were plotted against each other. From the same regions of interest the Pearson correlation coefficients (PCCs) were determined obtaining 0.44 ± 0.14 (CD63/actin), 0.39 ± 0.15 (CD63/CD151), and 0.41 ± 0.14 (CD151/actin) (values are given as means ± SD). (a–c: n = 49 aggregates from 20 cells collected from 3 biological replicates)

