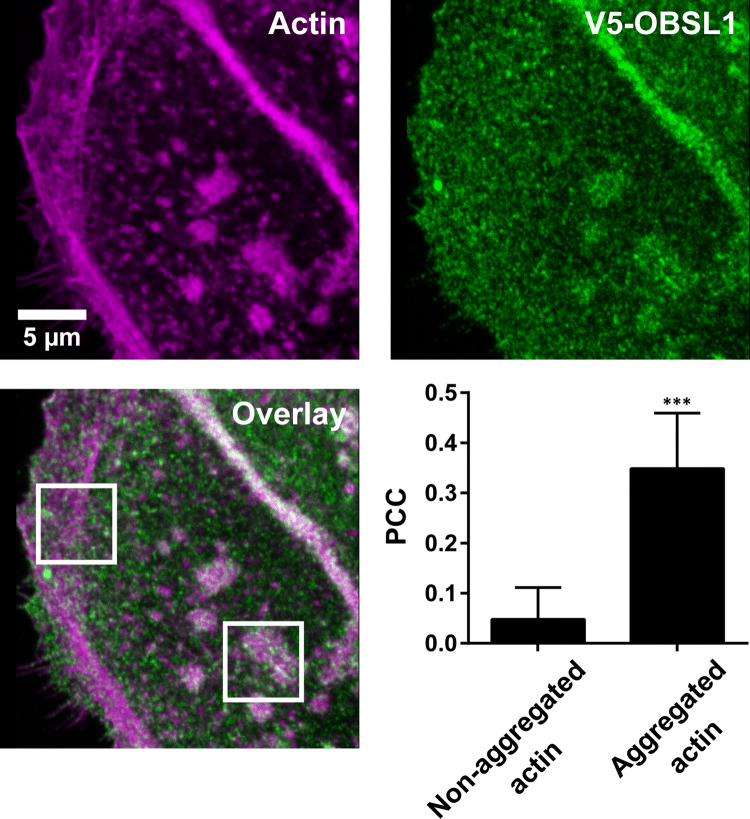
Fig. 5.
Overlap between actin and OBSL1. HaCaT cells were transfected with V5-OBSL1 and 1 day post transfection cells were incubated with PsVs for 3 h, fixed and stained for V5 with an antibody and for actin with phalloidin conjugated to a fluorophore. The linear lookup tables illustrate the channels for V5-OBSL1 and actin in green and magenta, respectively. The similarity between the OBSL1 and actin signals was quantified by calculation of the Pearson Correlation Coefficient (PCC). Values are shown as means ± SD (n = 21–27 ROIs, shown in Fig. S3, collected from 39 cells pooled from 4 biological replicates). ***, p < 0.001 (unpaired Student’s t-test, comparing aggregated to non-aggregated actin)

