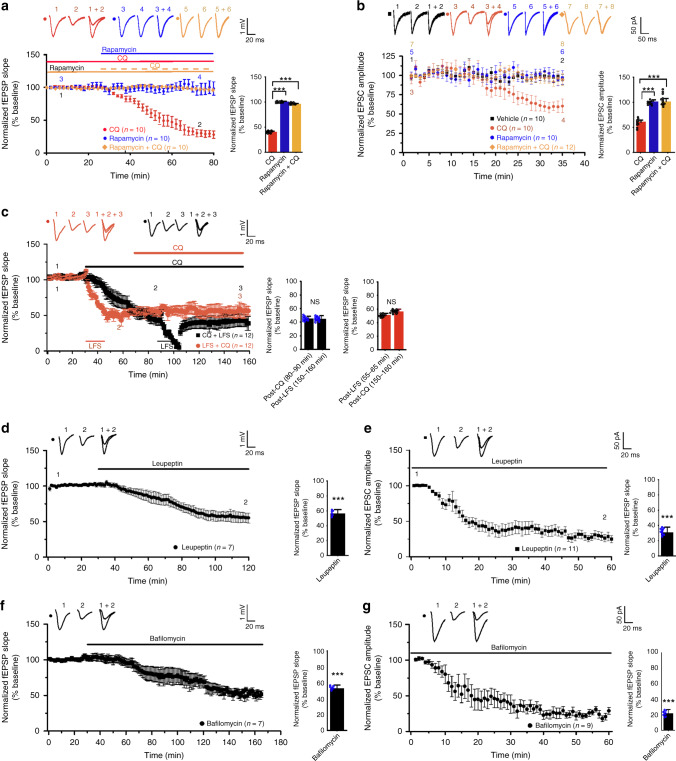
Fig. 3. Autophagy inhibitors induce synaptic depression.
a Field excitatory postsynaptic potentials (fEPSPs) evoked by stimulation at the Schaffer collateral pathway were recorded in the CA1 region of acute hippocampal slices; CQ (120 μM), rapamycin (1 μM), or CQ plus rapamycin was added to the bath; quantification on the right shows the average slope of fEPSPs recorded at 50–60 min after drug perfusion normalized to the pre-treatment baseline for the CQ and the rapamycin group, or to the pre-CQ baseline for the CQ plus rapamycin group; one-way ANOVA was used for statistical analysis and Bonferroni was used for post hoc analysis. b Excitatory postsynaptic currents (EPSCs) recorded in CA1 neurons in whole-cell mode; CQ (120 μM), rapamycin (1 μM), or CQ plus rapamycin was infused through the patching pipette; quantification on the right shows the average amplitude of EPSCs at 30–35 min normalized to that recorded at 0–5 min after breaking in; one-way ANOVA was used for comparison across groups; Bonferroni test was used for post hoc analysis. c CQ (120 μM) and LFS were applied sequentially to slices; quantification on the right shows the average slope of fEPSPs (recorded in designated time frames after the beginning of recording) normalized to the pre-treatment baseline; two-tailed paired t-test was used for statistical analysis. Slices were perfused with leupeptin (300 μM; d) or bafilomycin A1 (20 μM; f); quantification on the right shows the average slope of fEPSPs recorded at 80–90 min after drug perfusion normalized to the pre-treatment baseline; two-tailed Student’s t test was used for statistical analysis. CA1 neurons were infused with leupeptin (300 μM; e) or bafilomycin A1 (20 μM; g); quantification on the right shows the average amplitude of EPSCs at 35–40 min normalized to that recorded at 0–5 min after breaking in; two-tailed Student’s t test was used for statistical analysis. Data are presented as mean ± SEM; n indicates the number of slices (one slice from each animal); ***p < 0.001; no adjustments were made for multiple comparisons. Source data are provided as a Source Data file.

