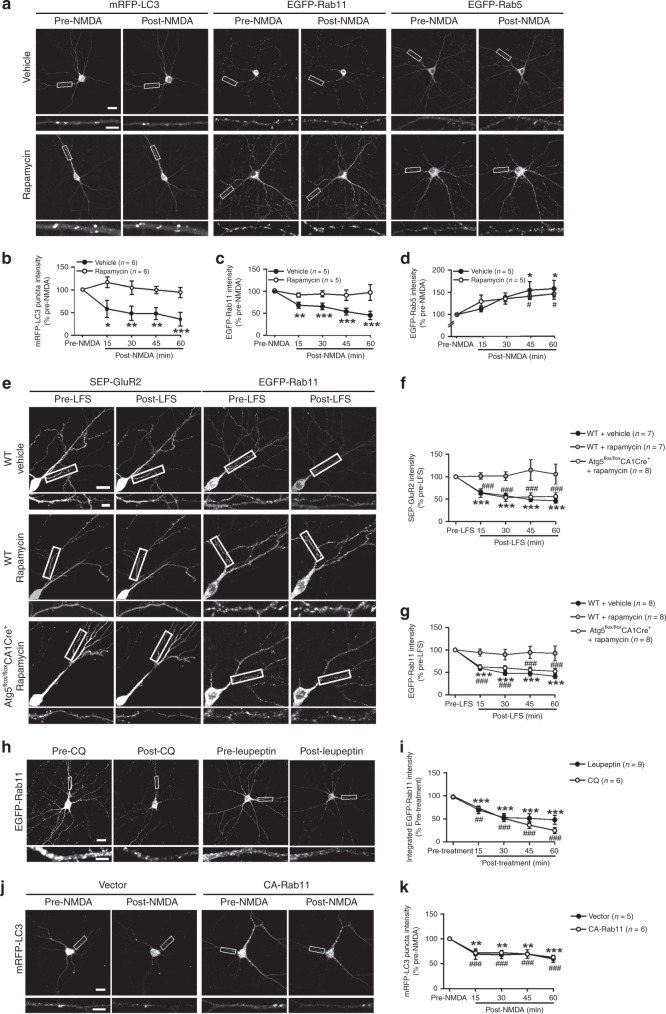
Fig. 5. Autophagy inhibition in LTD causes a decrease in recycling endosomes.
a Representative images of the same neuron before and after NMDA treatment. b–d Quantification of a; one-way RM ANOVA was used to compare across time points (vehicle: p = 0.001 in b, p = 0.000004 in c, p = 0.014 in d; rapamycin: p = 0.199 in b, p = 0.927 in c, p = 0.006 in d); time points significantly different from the pre-stimulation baseline were identified with Holm–Sidak test; *p < 0.05, **p < 0.01, ***p < 0.001 for the vehicle group in b–d; #p < 0.05, ##p < 0.01 for the rapamycin group in d. e Representative images of the same neuron in hippocampal slices before and after LFS (low-frequency stimulation). f, g Quantification for e; one-way RM ANOVA was used to compare across time points (f: WT + vehicle, p = 4.86 × 10⁻¹²; WT + rapamycin, p = 0.909; Atg5flox/floxCA1Cre+ + rapamycin, p = 2 × 10⁻⁶. g: WT + vehicle, p = 3.87 × 10⁻¹⁰; WT + rapamycin, p = 0.900; Atg5flox/floxCA1Cre+ + rapamycin, p = 2.68 × 10⁻¹⁰). h, j Representative images of the same neuron before and after treatment. i Quantification of h; one-way RM ANOVA was used to compare across time points (p = 1.0073 × 10⁻¹¹ for CQ and p = 5.85 × 10⁻⁷ for leupeptin); Holm–Sidak test was used to identify time points significantly different from the pre-stimulation baseline; ***p < 0.001 for CQ; ###p < 0.001 for leupeptin. k Quantification of j; one-way RM ANOVA was used to compare across time points (p = 0.00018 for vector, p = 0.000003 for CA-Rab11); Holm–Sidak test was used to identify time points significantly different from pre-stimulation; ***p < 0.001 for vector-transfected cells; ###p < 0.001 for CA-Rab11 transfected cells. Data are presented as mean ± SEM; n indicates the number of cells in b–d and h–k, and the number of slices in f and g; no adjustments were made for multiple comparisons. Scale bar: 20 μm in top and 5 μm in lower images. Source data are provided as a Source Data file.

